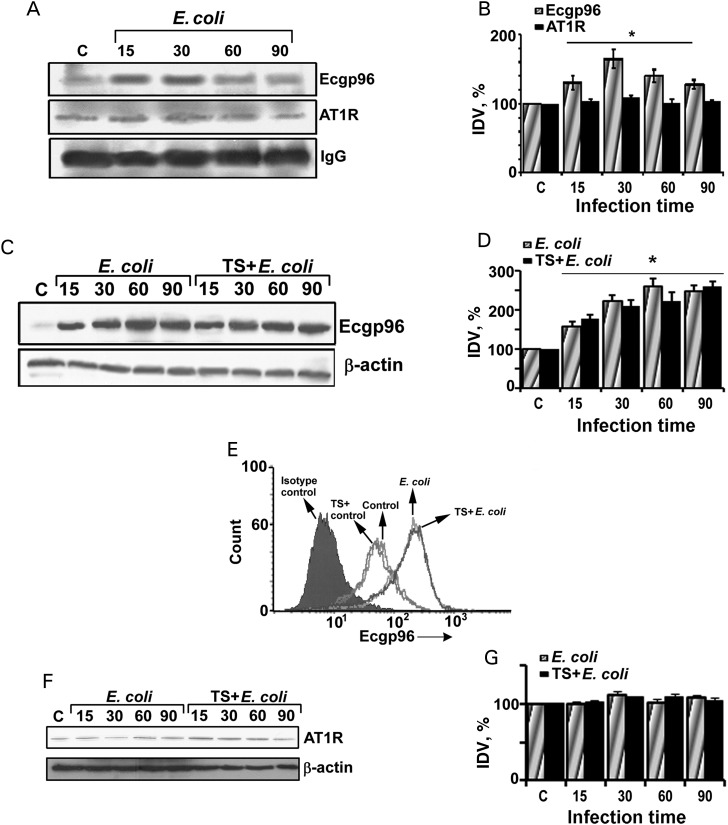
Figure 3.
Angiotensin II receptor type 1 (AT1R) associates with endothelial cell gp96 (Ecgp96) in both naive and infected human brain microvascular endothelial cells (HBMECs). A, HBMECs grown in T75 culture flasks were infected with Escherichia coli at a multiplicity of infection of 100 for various time points, and membrane fractions were isolated. A total of 300 µg of membrane proteins were immunoprecipitated with anti-Ecgp96 antibodies, and the immune complexes were subjected to Western blotting with antibodies to Ecgp96 (96 kDa) or AT1R (43 kDa). Equal loading was verified by the expression of immunoglobulin G (IgG) heavy chain fragment (55 kDa). The blots represent one of 3 experiments with similar results. B, Integrative densitometric values (IDVs) of band intensities of Ecgp96 and AT1R normalized to IgG IDV were graphed, with the IDV of the control considered as 100%. Increase in Ecgp96 expression during infection was statistically significant (*P < .005). C, Total cell lysates from E. coli–infected and TS-treated/E. coli–infected HBMECs were subjected to Western blotting using anti-Ecgp96 or anti-β-actin antibodies. Blots are representative of 3 different experiments. D, The IDV of Ecgp96 expression after normalization with β-actin for different infection time points was plotted as described above. The increase in Ecgp96 expression in HBMECs with or without TS treatment was statistically significant with respect to data for the uninfected control (*P < .01). E, HBMECs grown in 6-well plates were infected with E. coli with or without TS pretreatment for 60 minutes, and the surface expression of Ecgp96 was analyzed by flow cytometry using anti-Ecgp96 antibodies. Data are representative of 3 different experiments. F, Total cell lysates of HBMECs infected with E. coli in the presence or absence of TS were subjected to Western blotting using anti-AT1R antibodies. Equal loading was established using β-actin expression. G, The IDVs of bands from panel F were plotted for AT1R expression as mentioned above.

