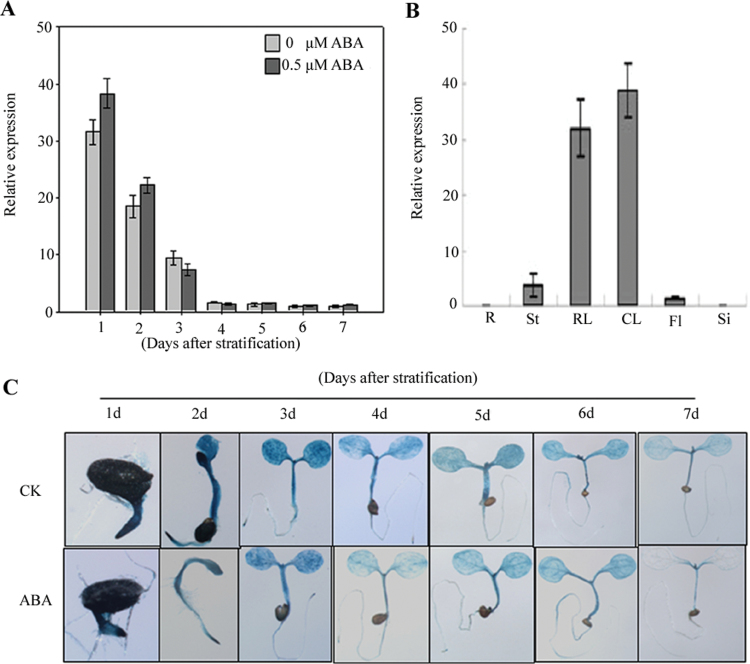
Fig. 2.
Expression pattern of AtSAG. (A) Relative expression of AtSAG during and after germination after the end of stratification in WT plants treated with 0 or 0.5 μM ABA. (B) Relative expression of AtSAG at differential tissues from the same growth stage in the WT plants. R, root; St, stem; RL, rosette leaf; CL, cauline leaf; F, flower; Si, silique. (C) GUS staining of the pAtASG::GUS transgenic germinating and germinated seedlings grown for 1–7 d on half-strength MS medium containing 1 or 0.5 μM ABA (this figure is available in colour at JXB online).

