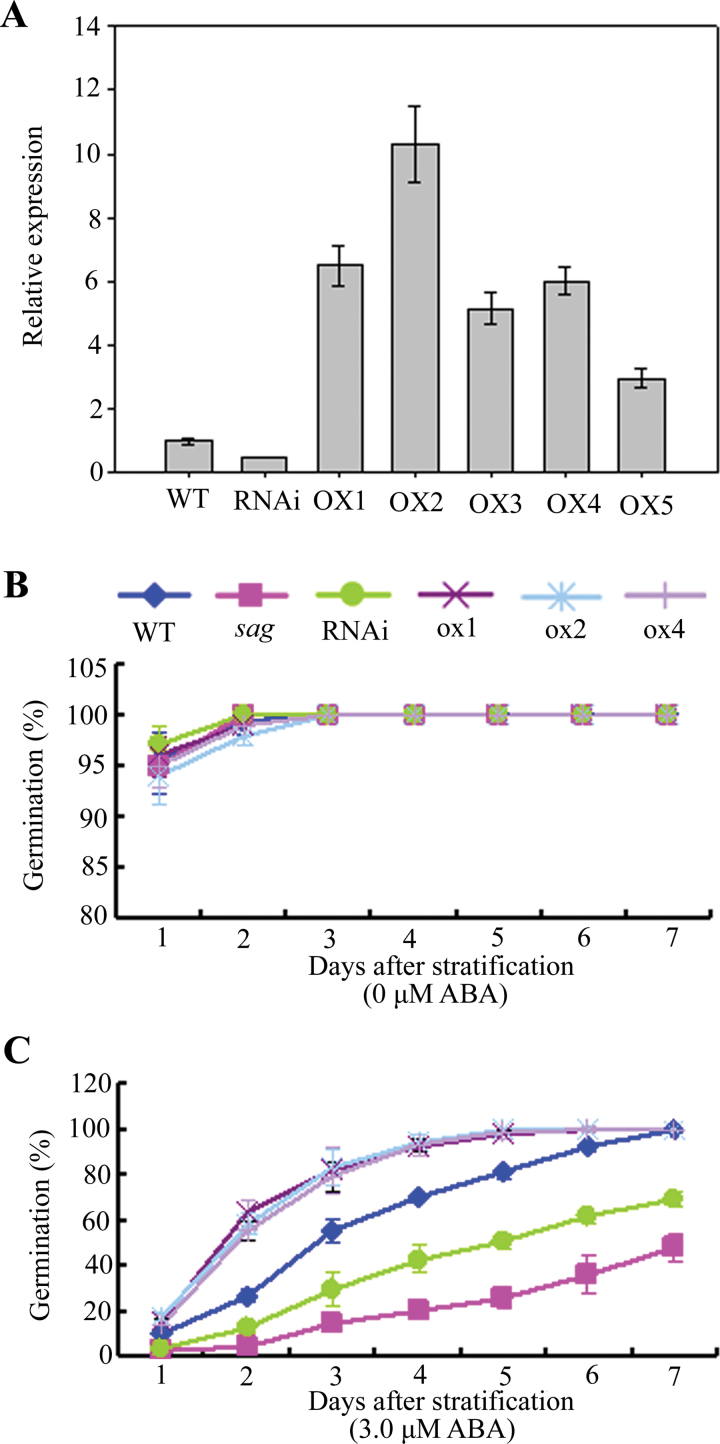
Fig. 4.
Expression analysis and abscisic acid (ABA) responses of the RNAi and OX lines of AtSAG. (A) Real-time PCR analysis of one RNAi line and five independent OX lines of AtSAG; cDNA was obtained from total RNA of 10-d-old seedlings of each phenotype; gene expression was normalized to the WT expression level, which was assigned as a value of 1; standard errors are shown as bars above the columns. (B and C) Seed germination of WT, RNAi, and three OX lines during the time course with 0 and 3.0 μM ABA respectively. Data are mean ± SD of at least three replicates; at least 100 seeds per genotype were counted in each replicate (this figure is available in colour at JXB online).

