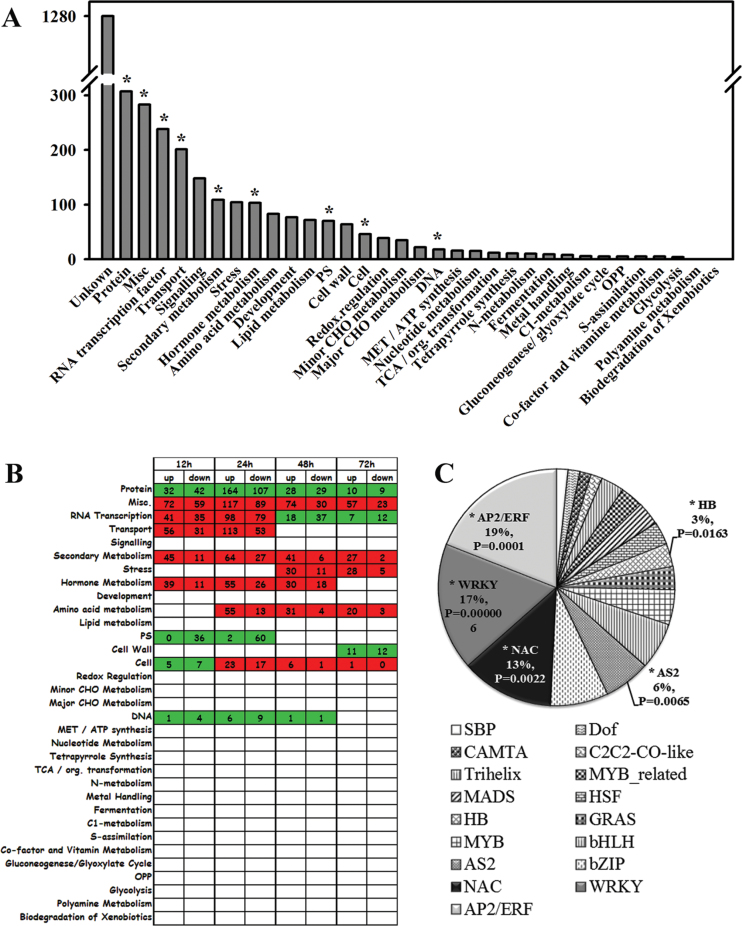
Fig. 4.
(A) Distributions and functional categories of the 3143 differentially expressed genes based on MapMan. (B) Distributions of the over-represented gene categories at different time points. Numbers in the squares indicate the number of over-represented up- or down-regulated genes in the corresponding functional categories. (C) The pie chart represents the family names and relative proportions of up-regulated transcription factors. * represents the over-represented categories (P < 0.001) or the transcription factors (P < 0.05) based on the hypergeometric distribution algorithm. (This figure is available in colour at JXB online.)

