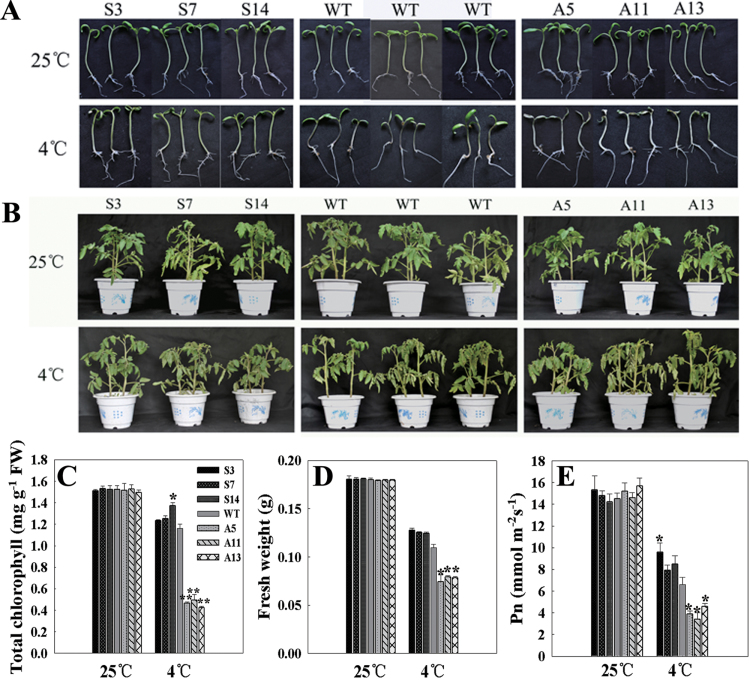
Fig. 5.
Growth analysis of young seedlings (10 d old) and grown plants (2 months old). (A) Growth performance of the young seedlings. (B) Growth performance of the grown plants. The top panel represents plants grown at 25 °C, and the bottom panel represents plants treated at 4 °C for 10 d (10-d-old young seedlings) or 24h (2-month-old grown plants). (C) Total chlorophyll content in the young seedlings. (D) Fresh weight of the young seedlings. (E) P n in the grown plants. Plants were treated at 4 °C, and P n was measured at 25 °C under ambient CO2 conditions (360 μl l−1). Before P n measurement, tomato plants were kept for approximately 30min at 25 °C with a PFD of 100 μmol m−2 s−1 to induce stomatal opening and then illuminated for approximately 15min at a PFD of 800 μmol m−2 s−1. For (C) to (E), each column represents the mean ±SD of three replicates. Statistically significant differences in comparison with the control are indicated: *P<0.05 and **P<0.01, respectively.

