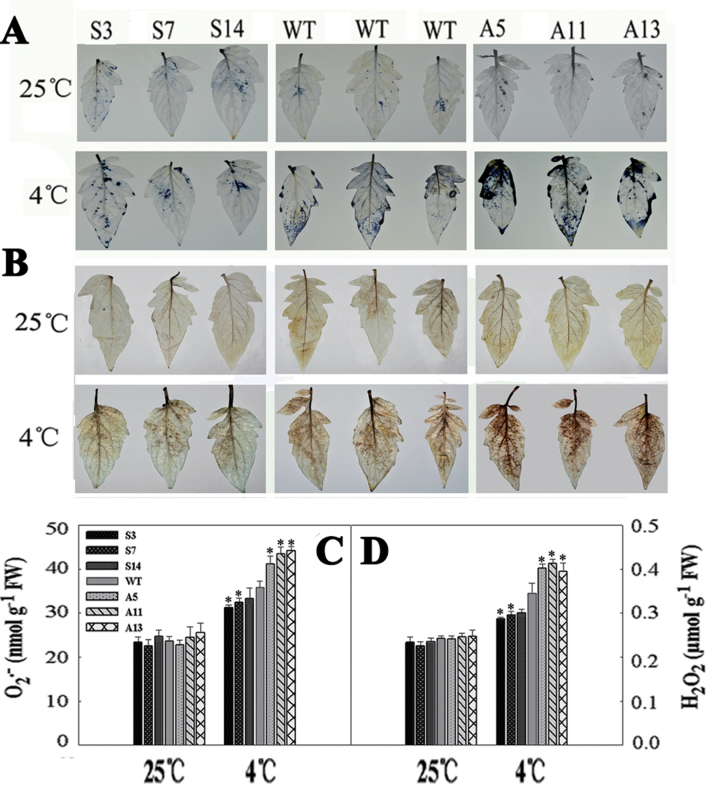
Fig. 6.
O2 • − and H2O2 analysis in the WT and transgenic plants. (A) NBT staining for O2 • −. (B) DAB staining for H2O2. The top panel represents plants grown at 25 °C and the bottom panel represents plants treated at 4 °C for 12h. (C) O2 • − content in tomato plants. (D) H2O2 content in tomato plants. The experiment was repeated three times with similar results. The data are represented as means ±SD of three biological replicates (*P<0.05). Two-month-old grown plants were used. (This figure is available in colour at JXB online.)

