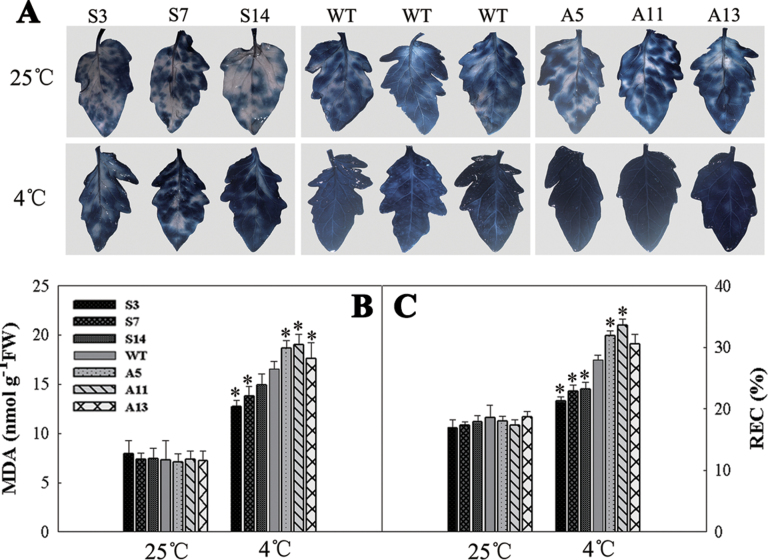
Fig. 7.
Membrane damage analysis in the WT and transgenic plants. (A) Trypan blue staining. The top panel represents plants grown at 25 °C and the bottom panel represents plants treated at 4 °C for 12h. (B) MDA content in the WT and transgenic plants. (C) REC in the WT and transgenic plants. Three independent experiments are shown as means ±SD. Asterisks indicate significant differences from WT of the same treatment (*P<0.05). Two-month-old grown plants were used. (This figure is available in colour at JXB online.)

