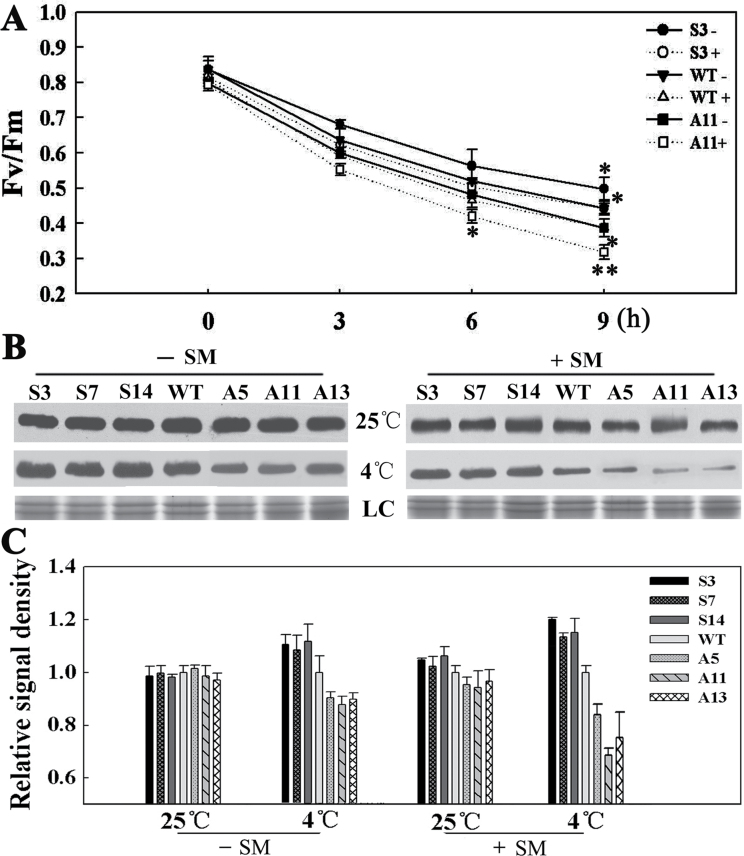
Fig. 9.
(A, B) Effect of SM and chilling stress on F v/F m (A) and D1 protein content (B). ‘–’ indicates untreated plants, and ‘+’ indicates plants treated with SM. Leaf discs were taken from plants grown at 25 °C, soaked in 3mM SM solution in the dark for 3h and exposed to 4 °C for 0, 3, 6, and 9h. Leaf discs were dark adapted for 30min before measurement. The data are represented as means ±SD of three biological replicates (*P<0.05; **P<0.01). LC, loading control (part of the Coomassie-stained thylakoid membrane protein SDS-PAGE gel). (C) Quantitative image analysis of the D1 protein content in (B) using a Tanon Digital Gel Imaging Analysis System. The relative protein level of D1 in the transgenic lines was normalized to that in the WT. Two-month-old grown plants were used. The data are shown as means ±SD.

