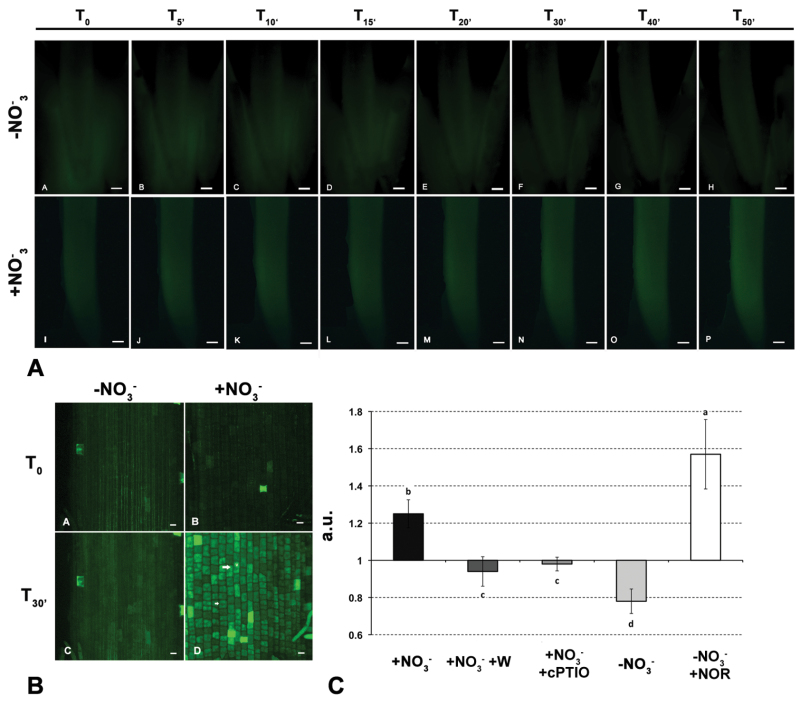
Fig. 5.
NO detection on 2-cm maize root apices excised from seedlings grown for 24h in nitrogen-depleted nutrient solution. (A) Stereomicroscope time course imaging of DAF-2T fluorescence (T0–T50) on apices treated for 30min with 1mM KCl (negative control, –NO3 –) (A–H), and 1mM KNO3 solution (I–P); bars, 500 µm. (B) Confocal detection of DAF-2T in the transition zone of nitrate-treated and untreated apices at T0 and T30. Arrows indicate two different types of cells of this root zone: small square-shape cells with central nucleus and elongated cells with a more developed vacuole (V); bars, 50 µm. (C) DAF-2T fluorescence intensity values at 30min after treatment of root segments with NO3 –, NO3 – and tungstate (W), NO3 – with the NO scavenger cPTIO, KCl (–NO3 –), KCl (–NO3 –) and NO donor NOR. Mean fluorescence values are reported as a ratio of the fluorescence intensity at 30min to the fluorescence intensity at time 0 (arbitrary units, a.u.). Different letters indicate statistically significant differences between treatments (P < 0.05, Kruskal–Wallis test) (this figure is available in colour at JXB online).

