Fig. 9.
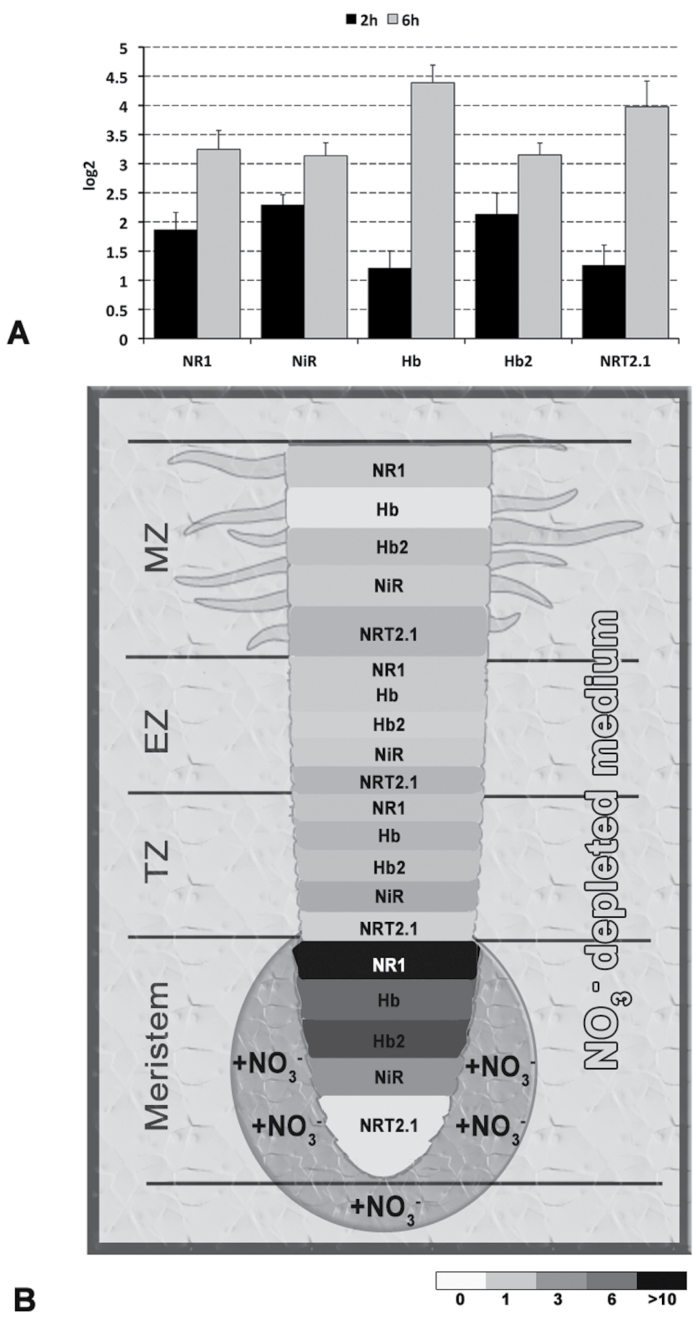
Expression analysis of NO- and nitrate-metabolism-related genes (NR1, Hb, Hb2, NiR, and NRT2.1) on roots of 24-h-old seedlings grown on nitrate-depleted agar and treated in a fresh medium added with nitrate in the whole plate or locally at the root tip. (A) Roots at 2h (black bars) and 6h (grey bars) after treatment; data are expressed as log2 ratios of the normalized expression levels measured in treated roots with respect to the control (no nitrate) grown at the same conditions; values are means ± SE of six independent biological replicates, each performed in three technical repetitions. (B) Fold-change (reference: untreated meristem) in gene expression along the root treated locally at the meristem zone with nitrate. The sizes of the different zones do not reflect the real values of length; please refer to the Material and methods for the exact measures. Values of fold-change are expressed by means of a grey scale. The authors arbitrarily chose the size of each block occupied by single gene, which do not reflect any quantitative value. M, meristem; TZ, transition zone; EZ, elongation zone; MZ, maturation zone.

