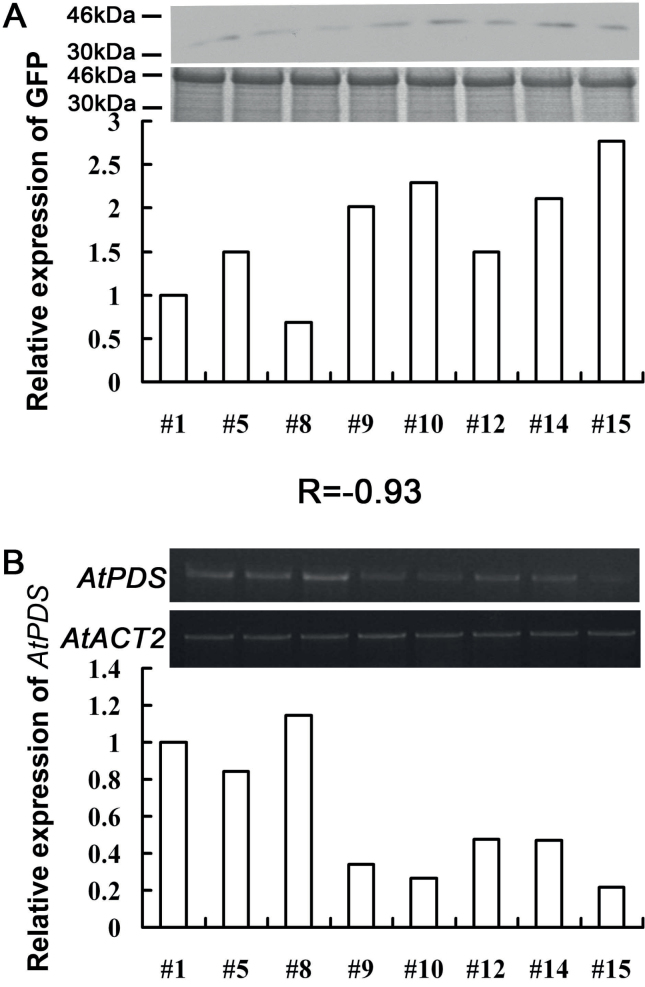
Fig. 5.
Correlation between CP–GFP protein level and abundance of the AtPDS gene in TRV–GFP-AtPDS-infected A. thaliana plants. (A) Level of accumulation of CP–GFP protein. Protein was extracted from the third leaf above the inoculated leaf at 7 dpi. A 10 μg aliquot of protein was used for western blot in each lane and anti-GFP was used to detect CP–GFP fusion protein. Molecular sizes are indicated. Coomassie blue staining was used for confirmation of equal loading in each lane. (B) Abundance of the AtPDS gene. Total RNA was extracted from the top young leaves of the A. thaliana plant which was used for western blot analysis at 14 dpi. AtACT was used as an internal control. The expression level of CP–GFP protein and the AtPDS gene was quantified by AlphaImager 2200. R is the correlation coefficient. Numbers indicate individual plants. The CP–GFP protein and AtPDS expression level in plant #1 was defined as 1, respectively.

