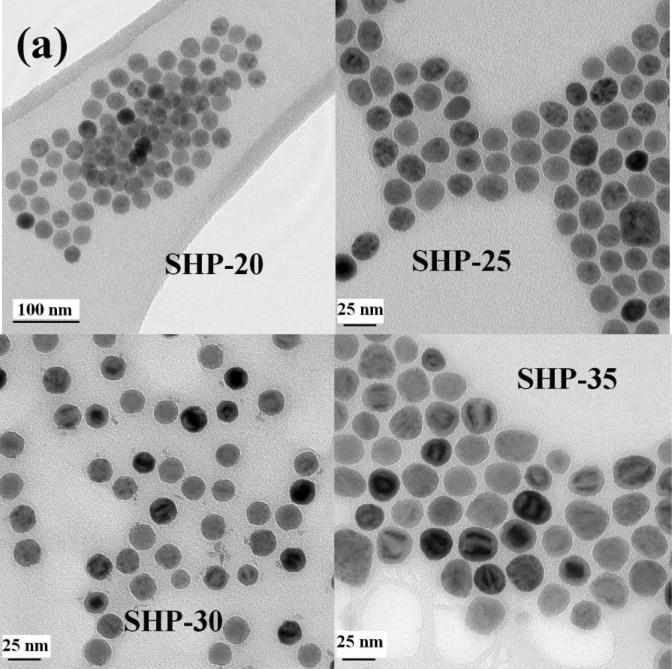
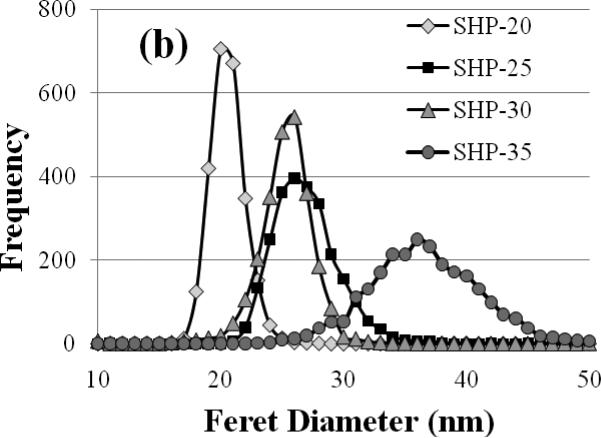
Figure 1.
(a) Transmission electron microscopy of Ocean nanoparticles with nominal diameters of 20, 25, 30, and 35 nm. The SHP-20 particles show a generally uniform intensity in TEM. In the images of the larger particles, an increasing number of particles exhibit intensity variations (light and dark bands), which we attribute to polycrystallinity. (b) Particle size distributions determined by user-guided image analysis of 2500 particles from each sample.


