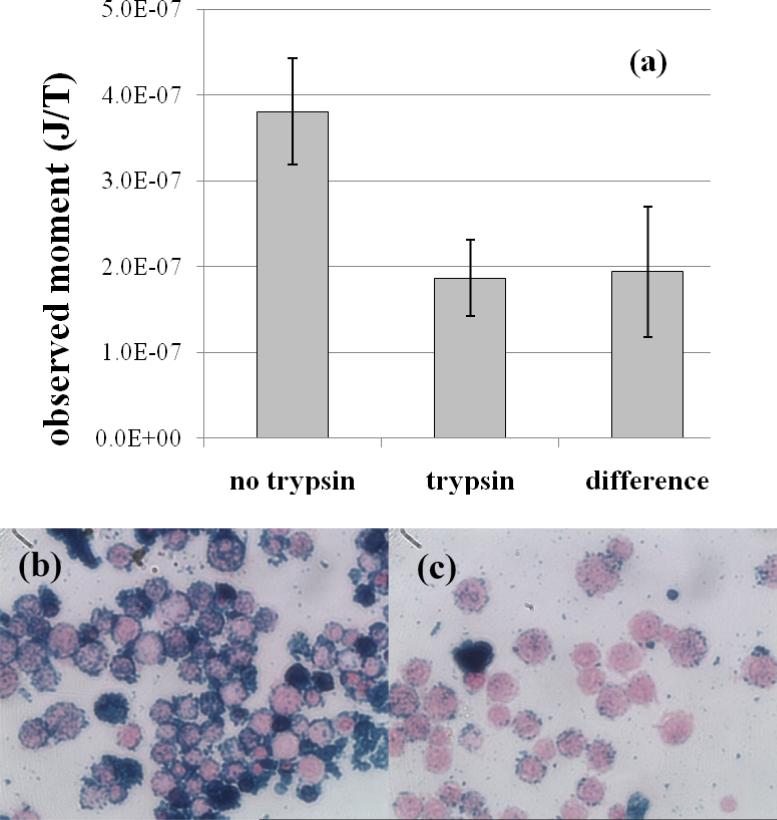
Figure 6.
(a) Observed magnetic moment from Ocean-SHP 30 nanoparticles, conjugated to CD3 antibody and incubated for 60 min. with normal Jurkat cells (no trypsin) and Jurkat cells treated with trypsin to remove cell surface antigens. Error bars represent the standard error of the mean (N=3). (b),(c) In photomicrographs of slides prepared after the 60 min. incubation, the Jurkat cells are stained pink, while the nanoparticles are stained blue. Untreated cells (b) express high levels of the CD3 receptor and show greater nanoparticle binding, while the trypsin-treated cells (c) are stripped of cell surface antigens and show significantly reduced binding. The observed SQUID relaxometry signal appears to be attributable to binding of nanoparticles to cells and some nanoparticle aggregation.

