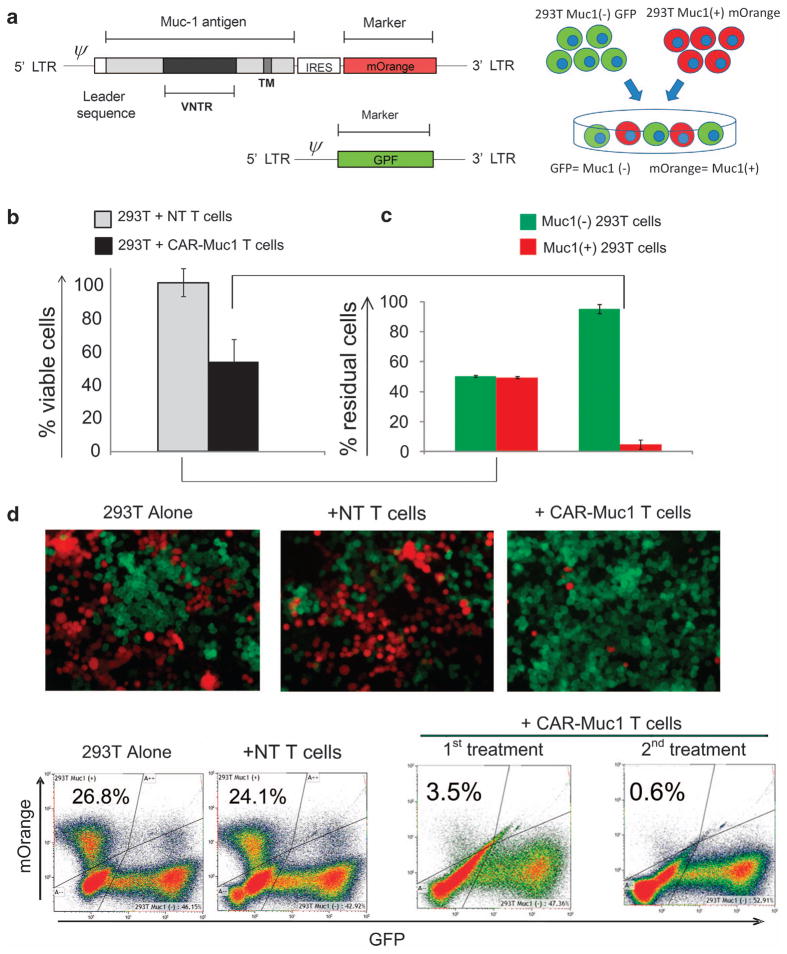
Figure 3.
Engineered 293T tumor model to investigate tumor immune escape due to heterogeneous tumor antigen expression. (a) (Left panel) shows the retroviral vector map of the Muc1-IRES-mOrange construct as well as the control GFP retroviral vector. 293T cells transduced to express either the mOrange (Muc1 +) or GFP (Muc1 −) vectors were sorted to 100% purity and then mixed at a 1:1 ratio, as shown in (a), right panel. (b) (Left panel) shows that CAR-Muc1 T cells (■) were able to kill ~50% of the 1:1 293T tumor mix (GFP/mOrange) while control NT T cells (
 ) have little impact on tumor cell growth. Cytotoxic activity was evaluated in a 72-h co-culture experiment (1:10 ratio of tumor:T cells) and the presented data represent the mean±s.d. of six donors. (b) (Right panel) shows flow cytometric analysis of residual tumor cells based on expression of GFP (Muc1 −) or mOrange (Muc1 +) (n =6). (c) Shows immunofluorescence images from one representative donor. (d) Shows flow cytometric analysis results from one representative donor where tumor cells were distinguished based on GFP (x axis) and mOrange (y axis) expression. Treatment with control NT T cells had no impact on tumor cell numbers, whereas a single treatment with CAR-Muc1 T cells decreased the mOrange (Muc1 +) population (upper left quadrant) to 3.5%, which was further reduced to 0.6% with a second treatment.

