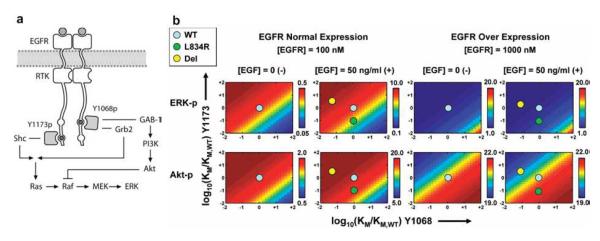
Figure 2.
Mechanistically linking EGFR point-mutations to altered signaling characteristics leading to the onset of oncogenic transformations. (a) Branched signaling model of the ErbB1, i.e., through two parallel phosphorylation pathways, corresponding to tyrosine 1068 (Y1068) and tyrosine 1173 (Y1173). (b) Calculated ERK and Akt phosphorylation levels in units of nM under serum starved (EGF−) and serum cultured (EGF+) conditions for cells with normal ErbB1 (EGFR) expression and ErbB1 over expression. In each panel the Y1173-ErbB1 affinity (KM) is varied along the x-axis (log value relative to wild-type) and the Y1068-ErbB1 affinity (KM) is varied along the y-axis. The blue circle denotes the wild-type, the green denotes the L834R mutant and the yellow the Del L723-S728 ins S (or Del) mutant cell lines. Reproduced with permission from (31).

