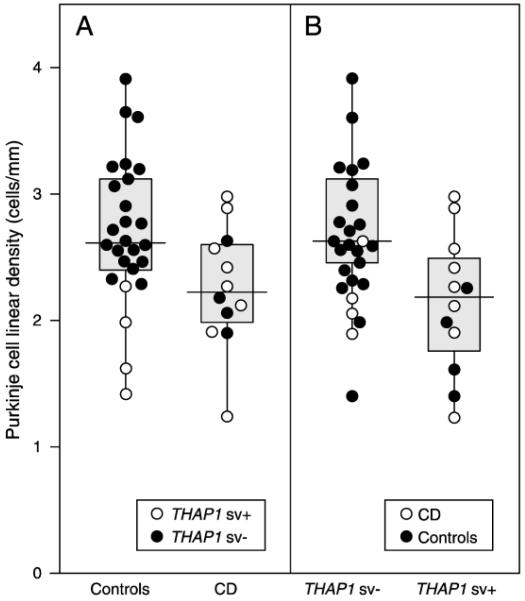
Figure 2. Cervical dystonia is correlated with a reduced Purkinje cell linear density independent of clinical manifestations.
A. Box and whisker plot and individual data points, comparing cervical dystonia with control subjects. Cervical dystonia (CD) was associated with significantly lower Purkinje cell linear density (p<0.05) B. Cases with THAP1 sequence variation (THAP1 sv+) had lower Purkinje cell linear density counts. Regression analysis showed that Purkinje cell linear density of THAP1 sv+ was significantly lower compared to THAP1 negative cases (THAP1 sv−) (p<0.05). (In A, open and closed circles represent the data for THAP1 positive and negative cases within each group. In B, open and closed circles represent the data for CD and controls within each THAP1 group.) (Reprinted with permission from Elsevier: Prudente CN, Pardo CA, Xiao J, et al. Neuropathology of cervical dystonia. Experimental neurology. 2013;241:95-104) [28**].

