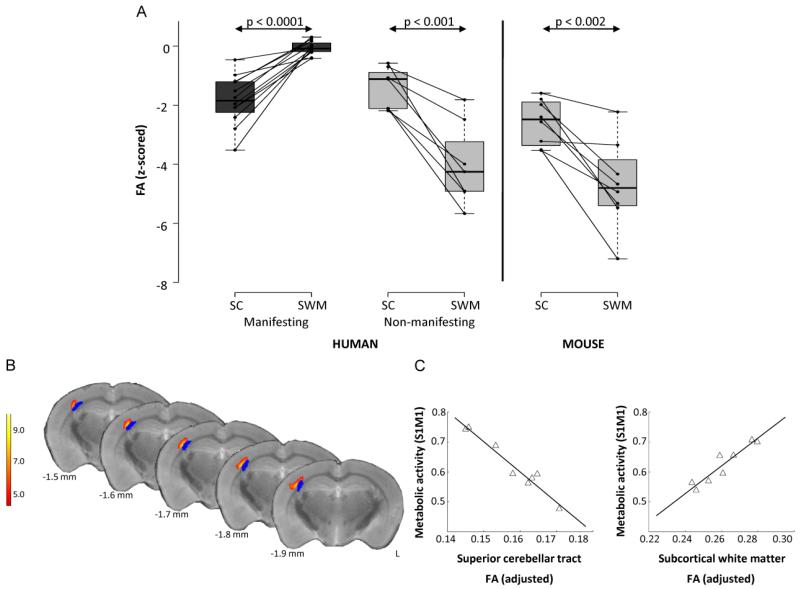
Figure 3. Comparison of connectivity values between human and mouse studies and metabolic abnormalities in mutant animals.
A. Regional differences in pathway microstructure: mechanism of penetrance. Left. Fractional anisotropy (FA) measured in the superior cerebellar (SC) pathway and in the subcortical white matter (SWM) subjacent to primary sensorimotor cortex in 12 manifesting (MAN) and eight non-manifesting (NM) genetic carriers of dystonia. For each region, individual subject FA values were z-transformed with respect to the corresponding cluster values from eight age-matched normal control subjects. Each of the two groups of gene carriers exhibited significant FA reductions in cerebellum relative to controls (p<0.001, Student’s t-test). By contrast, manifesting subjects had normal z-transformed values in the SWM, compared to non-manifesting carriers who had reduced values compared to control subjects (p<0.0001, Student’s t-test). Right. Analogous connectivity values in SC and SWM of DYT1 knock-in (KI) mice. Like human NM subjects, DYT1 KI mice had significantly reduced FA values in the SWM (p<0.0001, Student’s t-test). B. Voxel-wise multiple regression analysis revealed a relationship between connectivity values from proximal and distal cerebello-thalamocortical segments to the right sensorimotor cortex (S1M1) (yellow/red). This area was in close proximity to distal tract abnormality (blue). Color scale represents a t-value threshold of 5.89, corresponding to p<0.001. C. Multiple regression analysis examining relationship of proximal and distal pathway tract segments to S1M1 metabolic activity revealed a significant relationship between these measures (p<0.0001) expressed by y=ax1+bx1+c where a=−10.02 (p=0.0002), b=4.60 (p=0.0017), and c=1.01 (p=0.0034). The contribution of each abnormal white matter cluster to the metabolic activity is represented by the leverage plots. (Adapted from: Ulug AM, Vo A, Argyelan M, et al. Cerebellothalamocortical pathway abnormalities in torsinA DYT1 knock-in mice. Proceedings of the National Academy of Sciences of the United States of America. 2011;108:6638-43) [56**].

