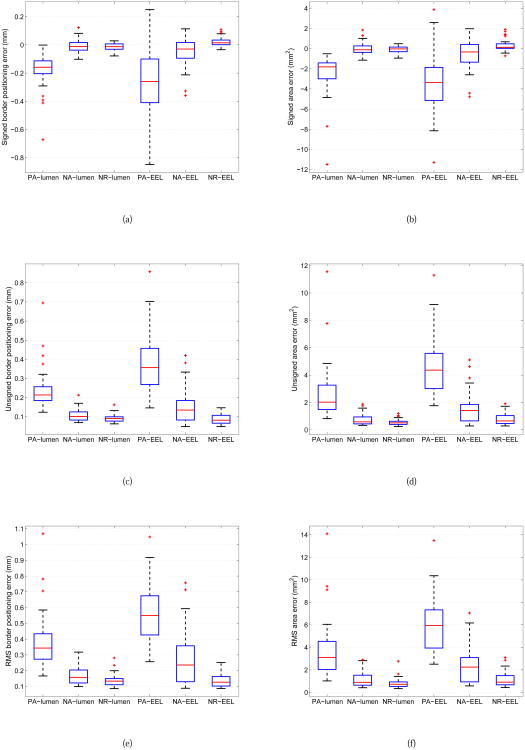
Fig. 9.
Comparison between boxplots of quantitative indices for IVUS segmentation of luminal and EEL surfaces with methods PA, NA, and RA. (a) Signed border positioning error. (b) Signed area error. (c) Unsigned border positioning error. (d) Unsigned area error. (e) RMS of border positioning error. (f) RMS of area error. The boxplots provide a graphical display of five statistical values (from the bottom to the top vertical line): the so-called smallest observation (Q1 − 1.5(Q3 − Q1)), first quartile (Q1), median (Q2), third quartile (Q3), and the so-called largest observation (Q3 + 1.5(Q3 − Q1)); + markers indicate outliers.

