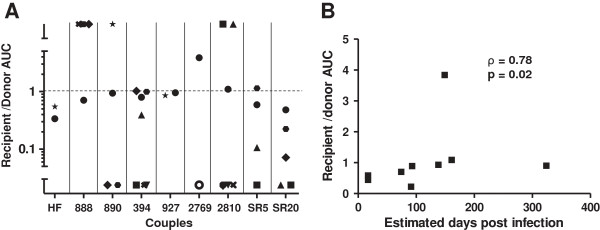
Figure 5.

Transmitter as compared to recipient envelope viruses replicate to higher levels in Langerhans cells (LCs) – heterologous activated CD4+ T cell cultures. (A) Recipient relative to transmitter envelope virus replication AUC among the 10 different skin donation volunteers LCs. Each symbol represents LCs from a different subject. The x-axis shows the couple’s ID. The dotted line at a ratio of 1 separates instances when the recipient envelope viruses replicated to a greater extent than the transmitter envelope viruses (> 1) or vice-versa (< 1). Symbols in the bottom and top third of the y-axis depict instances where replication was observed either only in the recipient or transmitter envelope virus within a partnership respectively. (B) Correlation between interval from estimated infection to sampling and recipient to transmitter replication AUC ratio. Graphs also shows the correlation coefficient with the Spearman rank correlation p - values.
