Figure 1.
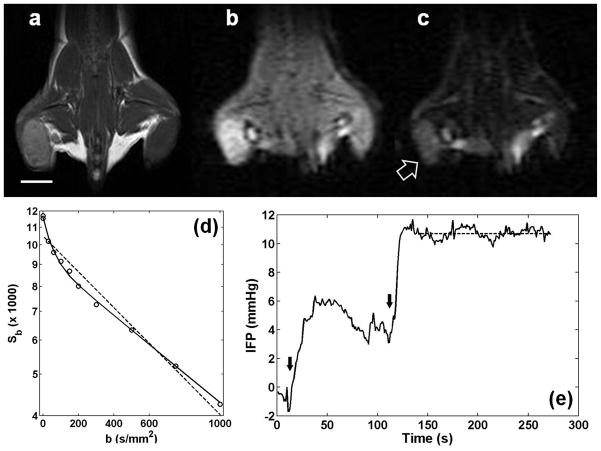
Mouse mammary carcinoma, 4T1, in the flank of a BALB/cJ mouse. (a) T2-weighted image using RARE sequence. The white line is a scale bar for 5 mm. (b) Diffusion weighted image with b=0. (c) Diffusion weighted image with b=1000 s/mm2. A block arrow indicates a solid tumor identifiable in a diffusion weighted image. (d) Diffusion weighted signals depending on b-values (Sb). Circles represent the average values from a region of interest covering the entire tumor in (a–c). Dashed and solid lines are the monoexponential and biexponential fits to all data points, respectively. This example shows that a mono-exponential model is not adequate to describe diffusion weighted signal decay in the selected tumor. (e) An example of interstitial fluid pressure measurement using the WIN system. As the needle was inserted into the tumor, the pressure rose slowly. The insertion was stopped at the tumor rim around t = 50 s. Then, it was inserted further to the center of the tumor. The dashed line indicates a plateau region over which the average tumor IFP of 10.7 mmHg was measured. Black arrows show when the needle was moved into the tumor.

