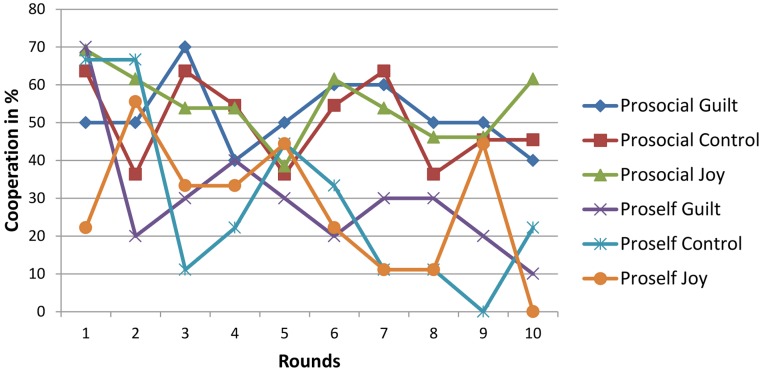
Figure 1. Cooperation in % for each round of the PDG.
Figure shows the mean percentages of cooperative responses for each group, plotted against each of the 10 rounds. Visual inspection suggests a rather high fluctuation over the first five rounds, but with a pattern beginning to emerge from round six onwards that seems to be influenced by SVO.

