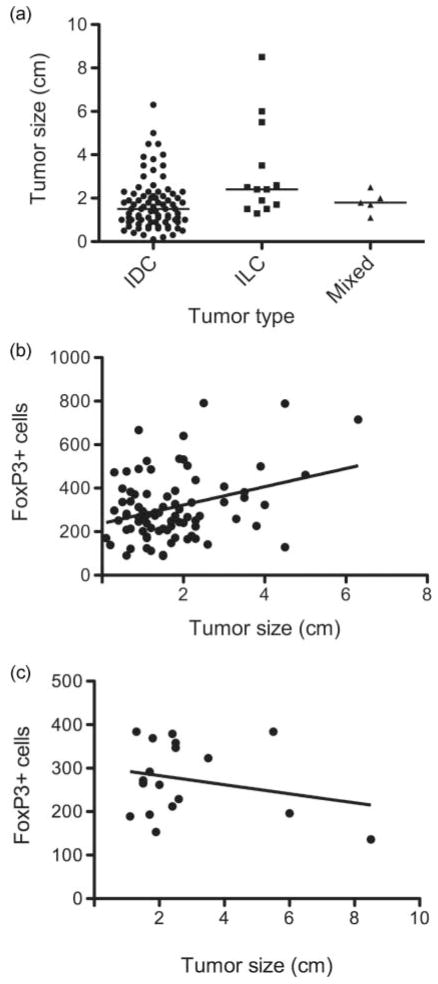
Figure 2.
The number of FoxP3+ lymphocytes in SLNs correlates with the tumor size of invasive ductal carcinomas. (a) Comparison of the tumor size distribution between invasive ductal carcinoma (IDC), invasive lobular carcinoma (ILC), and carcinomas with mixed features. Horizontal bars indicate the median in each group. (b) and (c) Scatter plots of FoxP3+ cell numbers versus tumor size for (b) ductal and (c) non-ductal (ILC and mixed) carcinomas. Regression lines shown are given by the equation: (b) predicted FoxP3 cell number = 237.9 + 42.14 × tumor size; (c) predicted FoxP3 cell number = 303.9 – 10.49 × tumor size.

