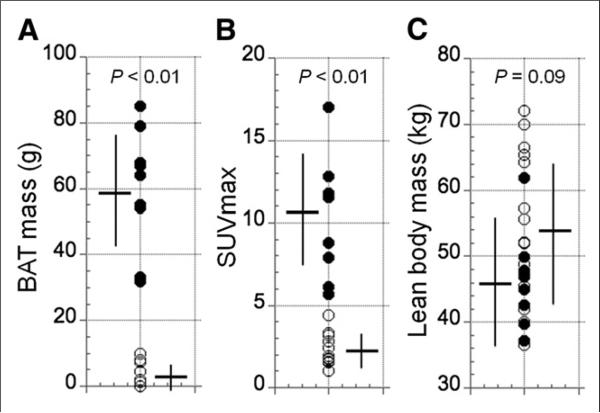
FIGURE 3.
Distribution of amount of BAT mass, maximal SUV, and lean body mass in high-BAT group (●, n = 9, 8 women and 1 man) and in low-BAT group (○, n = 16, 7 women and 9 men). Error bars represent SD of measurements. (A) Amount of BAT mass was highly variable, displaying bimodal distribution. Accordingly, subjects were stratified into high-BAT and low-BAT groups. (B) Maximal SUV in BAT was significantly higher in high-BAT group than in low-BAT group (P < 0.01). (C) Because of higher male-to-female ratio in low-BAT group, lean body mass showed tendency toward higher values in low-BAT group.

