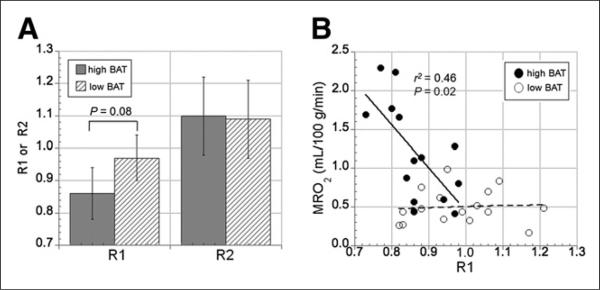
FIGURE 7.
NIRS-derived measures (R1 and R2) in BAT and WAT. (A) Comparison between R1 and R2 in high-BAT (gray bars) and low-BAT (hatched bars) groups. Consistent with higher BAT oxygen depletion in high-BAT group, R1 ratio in this group tended to be significantly lower than in low-BAT group (P = 0.08). R2 ratios were similar in both groups, indicating that oxygen demand in abdominal subcutaneous WAT is comparable in the 2 groups. (B) Relationship between BAT MRO2 and R1 in both high-BAT (●) and low-BAT (○) groups. Significant correlation between R1 and MRO2 was observed in high-BAT group, indicating higher oxygen depletion in venous blood (reflected in low R1 values) at high MRO2 in BAT. In contrast, no significant relationship between R1 and MRO2 was found in low-BAT group.

