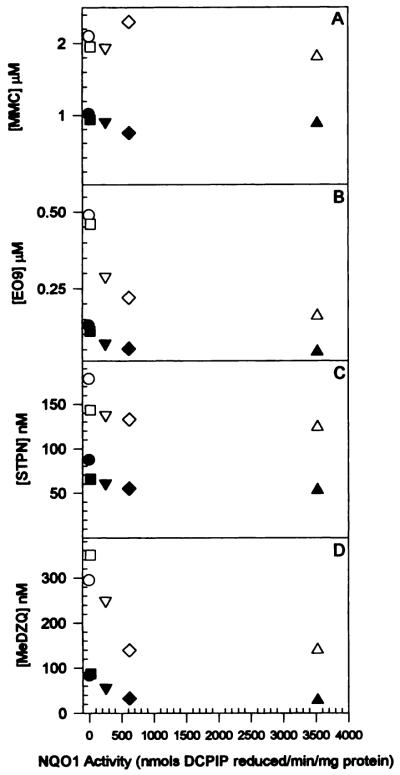
Fig. 3.
D50 and D10 values for MMC (A), EO9 (B), STPN (C), and MeDZQ (D) to CHO and human NQO1-expressing CHO cells plotted versus NQO1 activity in each cell line. Values were calculated from semilog plots of percent survival versus drug concentration. D10 values were estimated by extrapolation for survival curves not extending below 10% survival. Filled symbols, D50; open symbols, D10.

