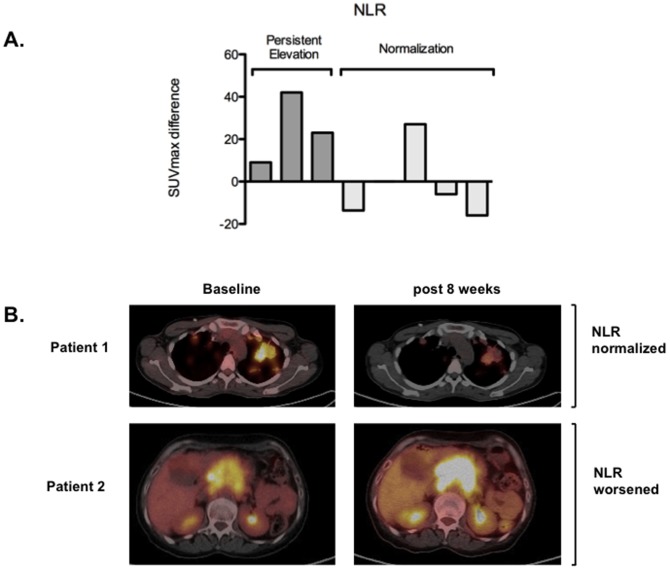
Figure 3. Exploratory subanalysis investigating the relationship between NLR normalization and 18FDG-PET SUVmax in patients treated with a molecularly targeted IMP (n = 8).
Panel A: Waterfall plot showing individual metabolic responses in patients with normalized versus persistently elevated NLR following treatment. Panel B: Representative PET-CT fused axial images obtained at screening and after 8 weeks of treatment with an oral targeted agent. In patient 1 a 15% reduction of SUVmax in the region of interest is associated with NLR normalization following treatment. In patient 2 metabolic progression of disease, with a 40% increase in SUVmax is associated with worsening of the NLR at the time of disease reassessment.

