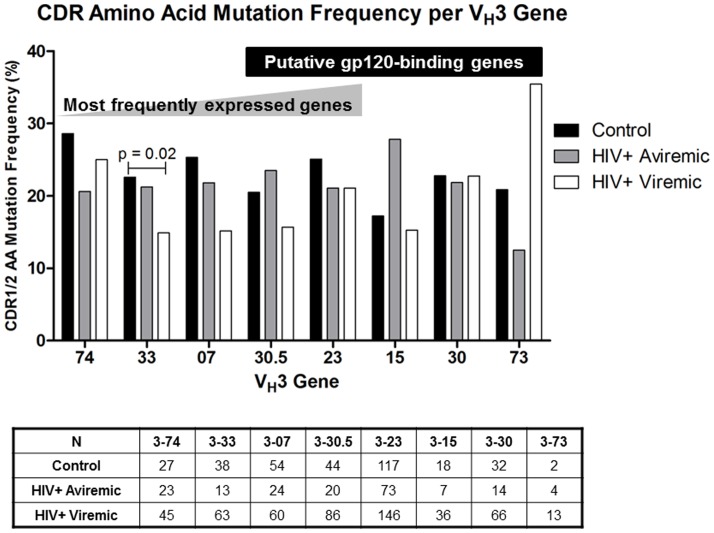
Figure 4. Frequencies of amino acid replacement mutations in specific VH3 genes.
The group median for CDR1/2 in each of the 5 most frequently expressed VH3 genes (VH3-74, -33, -07, -30.5, and -23) and for the VH3 genes proposed to bind to HIV-1 gp120 outside of the antigen binding region (VH3-30.5, -23, -15, -30, and -73) are calculated from the mean mutation frequencies for each individual subject in control (n = 10; black bars), aviremic (n = 6; gray bars), and viremic groups (n = 15; white bars). The table below shows the total number of sequences cloned (N) for each gene by group. P values were calculated for each gene. Only the overall p value for VH3-33 was significant (p = 0.02). Secondary analyses: control vs. viremic p<0.05; all other comparisons p>0.05.

