
Figure 6. Viability of HDF exposed or not exposed to UVA (365 kJ/m2), determined using the MTT assay, at time 0 and after 24 h.
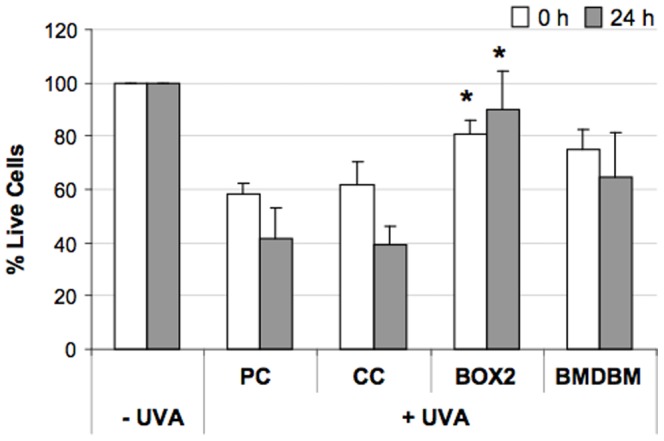
HDF were either screened with formulations (BOX2, BMDBM), control cream (CC) or not screened at all (PC, positive control). Data are expressed as percentage of live cells compared to unexposed controls (−UVA). Error bars represent ± S.D. * vs PC.