
Figure 7. Flow cytometric analysis of intracellular levels of ROS in HDF, exposed or not exposed to UVA (365 kJ/m2), determined using the carboxy-DCFH-DA assay.
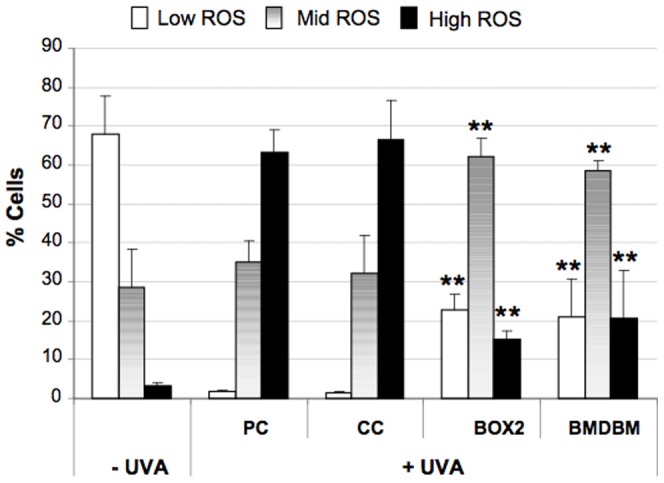
HDF were either screened with formulations (BOX2, BMDBM), control cream (CC) or not screened at all (PC, positive control). Data are reported as percentage of cells presenting low (□), mid ( ) and high (▪) intracellular levels of ROS expressed in terms of carboxy-DCF fluorescence. Error bars represent ± S.D. ** vs PC.