
Figure 9. Cellular DNA damage in HDF, exposed or not exposed to UVA (365 kJ/m2), assessed using the standard alkaline comet assay (−FPG) and the modified version with FPG (+FPG) for detection of oxidised purines.
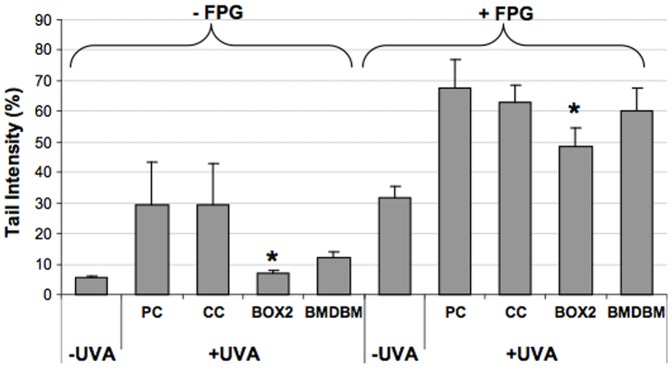
HDF were either screened with formulations (BOX2, BMDBM), control cream (CC) or not screened at all (PC, positive control). Data are reported as the average of the median values of tail intensity. Error bars represent ± S.D. * vs PC.