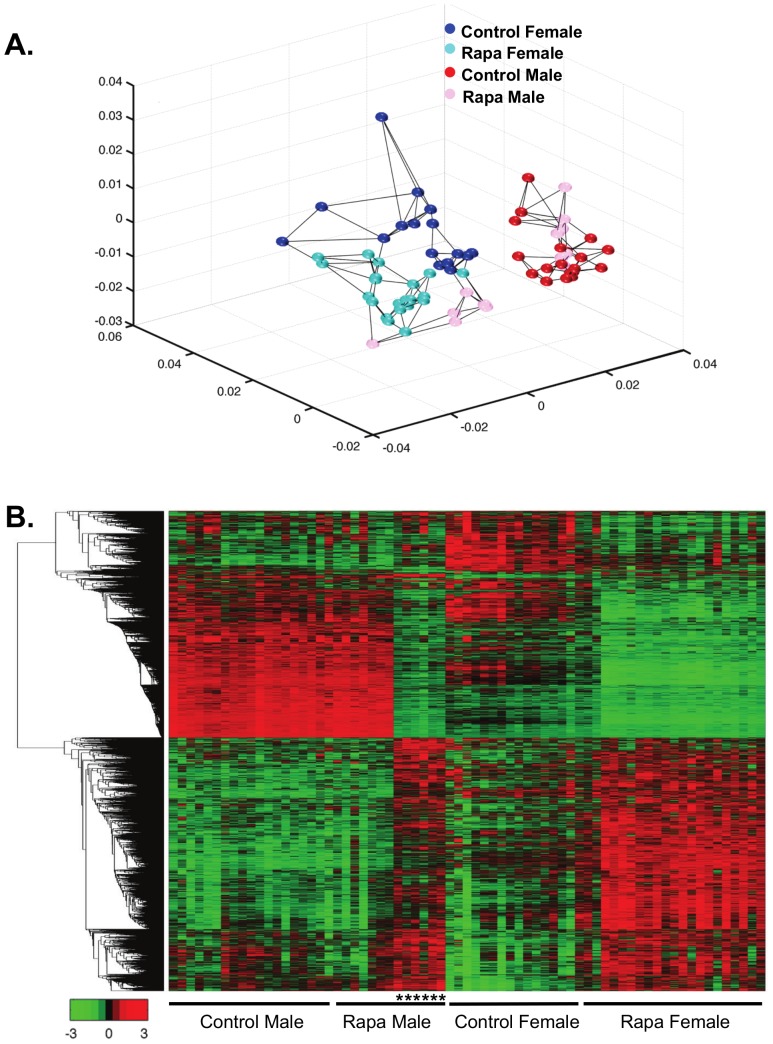
Figure 3. Multidimensional scaling and heatmap analyses shows the separations of Rapa and control groups.
Multidimensional scaling analysis was conducted using all the probes detected (25,697 probes) on the microarrays (A). Control males are shown in red, Rapa males in pink, control females in blue, and Rapa females in cyan. Each dot represents one sample and the lines indicate the three nearest neighbors. In the females, the Rapa mice segregate separately from the control mice, while in the males, 7 Rapa mice group similar to the control males and 6 of the Rapa males do not group with the control males. From this analysis, we separated the Rapa males into two groups for subsequent analysis, Rapa-1 males as the group that appears similar to the control males and Rapa-2 males as the group that appears different from the control males. The heatmap analysis shows the expression of all transcripts that were observed to change significantly with Rapa in both male and female mice (B). The genes were clustered using linkage hierarchical cluster with Euclidean distance. The transcript expressions are shown with red for high, black for middle, and green for low expression. The male mice in Rapa-2 are shown by the asterisks. A list of the transcripts that significantly changed with chronic Rapa feeding is shown in the same top to bottom clustering order as the heatmap in File S2, tab1.

