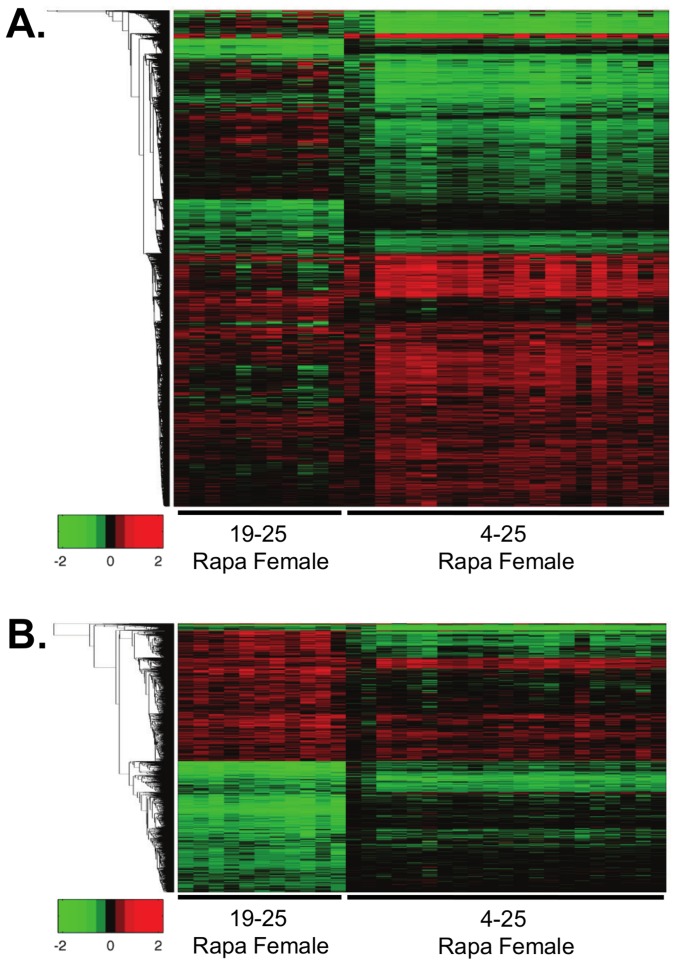
Figure 7. Relative heatmap analysis indicates high degree of similarity between 6-months and chronic Rapa feeding in female mice.
Heatmap analysis of individual, 25-month-old female mice fed Rapa for 6 (6-months) or 21 (chronic) months compared to the respective average of the control females are shown. The transcripts that are significantly changed in 6-months or chronic Rapa females are shown in (A) and the transcripts that only significantly change in 6-months Rapa females are shown in (B) compared to chronic Rapa females. For this heatmap analysis, red indicates up-regulated transcripts, green indicates down-regulated transcripts, and black indicates little or no change. The transcripts were plotted using log2 values and the heatmap scales from a change of −2 to 2 log2 change. A list comparing the transcripts that significantly changed with 6-months or chronic Rapa feeding is shown in the same top to bottom clustering order as the heatmap in File S2, tab6.

