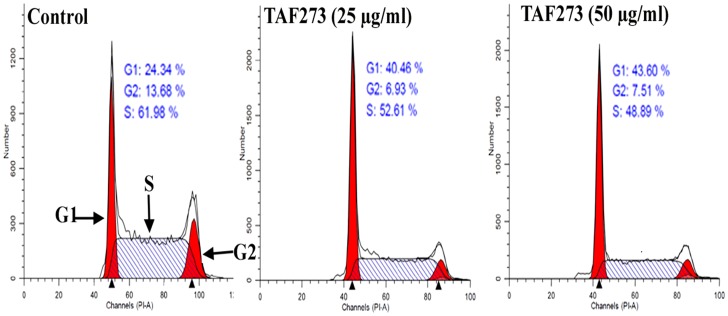
Figure 4. Effect of TAF273 on cell cycle distribution in K-562 cells treated for 72 h.
The flow cytometry analysis of PI-labeled cells indicates that treatment of K-562 cells with 25 µg/ml of TAF273 for 72 h led to increase in the G1 population from 24.34% in the control cells to 40.48% in treated cells. In mean time, the S and G2 populations decreased from 61.98% and 13.68% in the control cells to 40.48% and 6.93% in treated cells, respectively. On the other hand, treatment with TAF273 (50 µg/ml) caused increase in G1 population from 24.34% to 43.60% in the control and treated cells, respectively. In contrast, S and G2 populations decreased from 61.98% and 13.68% in the control cells to 48.89% and 7.51% in the treated cells, respectively.

