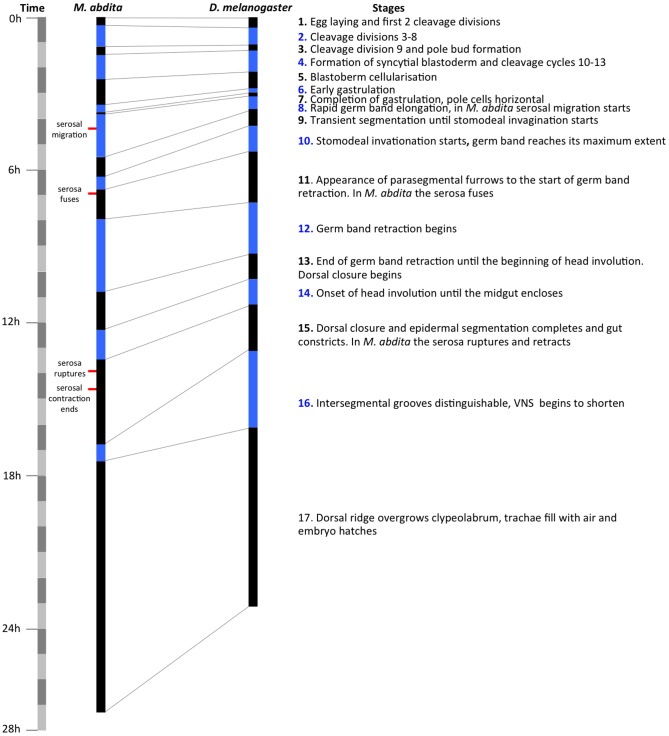
Figure 3. Comparative timing of developmental stages in M. abdita and D. melanogaster.
The duration of each stage is shown for M. abdita and D. melanogaster in alternating black and blue bars. The time scale is divided into blocks of 1 hr on the far left hand side. A brief description of each stage is given on the right. Landmarks of extraembryonic tissue formation and retractions are indicated to the left of the M. abdita time scale.

