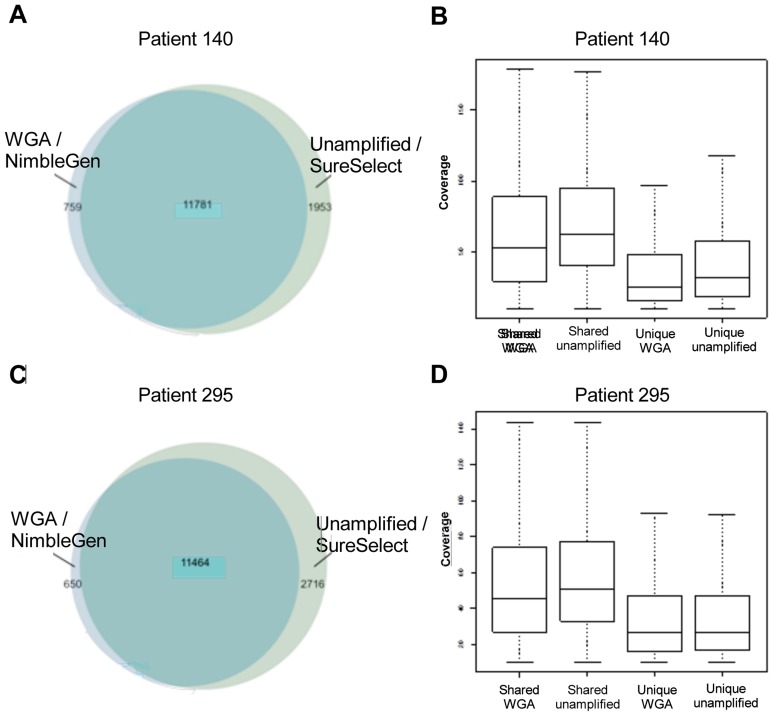
Figure 1. Genetic variants unique or shared between analysis.
A) Venn diagram illustrating the distribution of SNVs for patient 140. Unique variants found by WGA are represented in light blue, and unique variants found without amplification are shown in light green. Shared variants identified by both methods are shown in green. B) Boxplot of the coverage of genetic variants found uniquely by WGA, without amplification, and with both methods for patient 140. The two leftmost boxes represent shared variant calls with coverage in those positions for WGA and without amplification, respectively. The two rightmost boxes represent the coverage over unique positions for each method. C) Venn diagram illustrating the distribution of SNVs for patient 295. Unique variants found by WGA are represented in light blue, and unique variants found without amplification are shown in light green. Shared variants identified by both methods are shown in green. D) Boxplot of the coverage of genetic variants found uniquely by WGA, without amplification, and with both methods for patient 295. The two leftmost boxes represent shared variant calls with coverage in those positions for WGA and without amplification, respectively. The two rightmost boxes represent the coverage over unique positions for each method.

