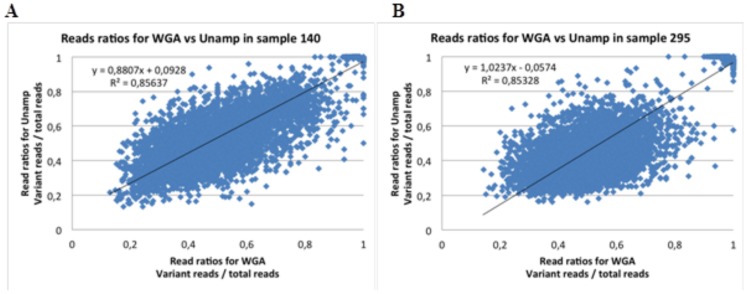
Figure 3. The relationship between variant and total reads per position depending on analysis.
A) The relationship between the numbers of variant reads divided by total reads for SNVs identified by sequencing WGA and unamplified DNA per position in patient 140. B) The relationship between the numbers of variant reads divided by total reads for SNVs identified by sequencing WGA and unamplified DNA per position in patient 295.

