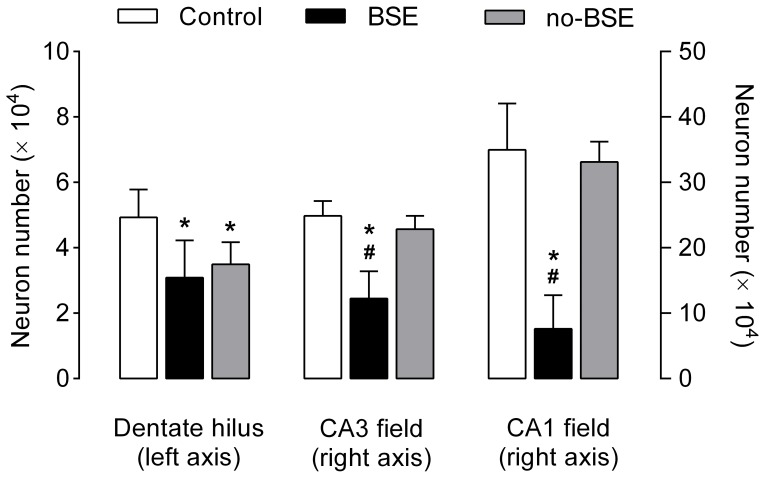
Figure 7. Loss of hippocampal neurons in kainate-treated rats.
The y-axes represent the total numbers of neurons (mean±SD) in the dentate hilus and hippocampal CA3 and CA1 pyramidal fields in control rats and in kainate-treated rats with and without behavioral status epilepticus (BSE group and no-BSE group, respectively). The number of hilar neurons is reduced in both groups of kainate-treated rats when compared to control group. Note that the number of cells in the CA3 and CA1 pyramidal regions was strikingly reduced in rats from the BSE group, but not in those from the no-BSE group. Dentate hilus: *p<0.05 for no-BSE group vs. control group and p<0.01 for BSE group vs. control group; CA3 and CA1 fields: *p<0.001 vs. control group and # p<0.001 vs. no-BSE group.

