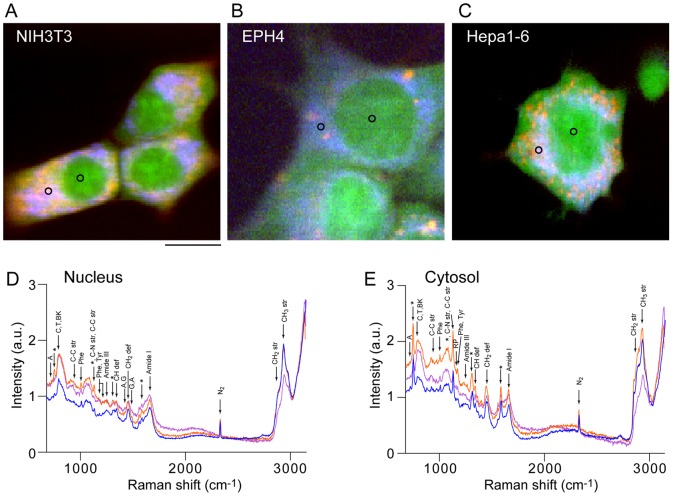
Figure 1. Raman images of three cell-lines.
RGB reconstituted Raman images of NIH3T3 (A), EPH4 (B) and Hepa1–6 (C) cells. Raman peaks at 753 cm−1 (cytochrome C), 1686 cm−1 (proteins), and 2852 cm−1 (lipids) are mapped in blue, green, and red, respectively. Scale bar, 10 µm. (D) Raman spectra of the nuclei of NIH3T3 (blue), EPH4 (purple) and Hepa1-6 (orange) cells. (E) Raman spectra of the cytosol of NIH3T3 (blue), EPH4 (purple) and Hepa1-6 (orange). The representative Raman spectra shown are the average of spectra at 49 pixel positions in the black circled region in A–C. Peak assignments are, RP; rebose-phosphate, BK; backbone OPO of nucleic acid, str; stretching, def; deformation [31]. Peaks characteristic to cytochrome C are indicated with asterisks.

