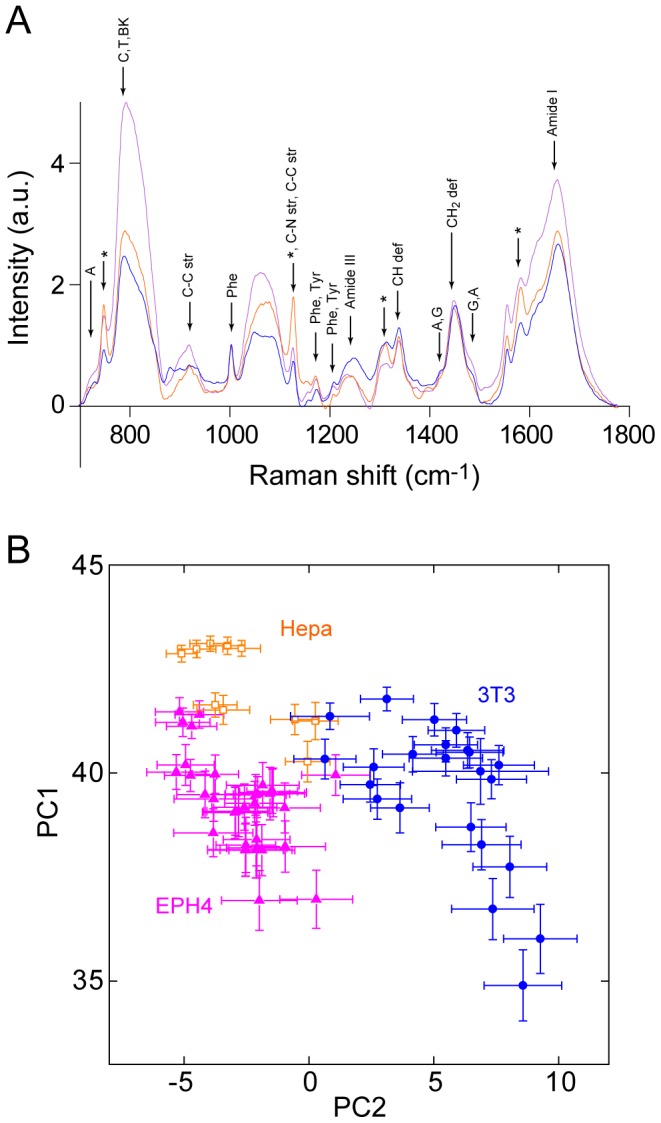
Figure 2. Difference in Raman spectra between cell-lines.

(A) Averaged Raman spectra of NIH3T3 (blue), EPH4 (purple) and Hepa1-6 (orange) cells in the fingerprint region (700–1800 cm−1). Raman spectra are average of 10–34 cells for each cell-line. The lower envelope, which was estimated by a 4th-order polynomial fitting, was subtracted from all spectra in order to make the spectral differences clearer for comparison [32]. (B) Score plots calculated by PCA for three cell-lines. For PCA analysis, raw spectra without averaging was used. Each symbol represents a single cell. NIH3T3 (blue), EPH4 (purple) and Hepa1-6 (orange).
