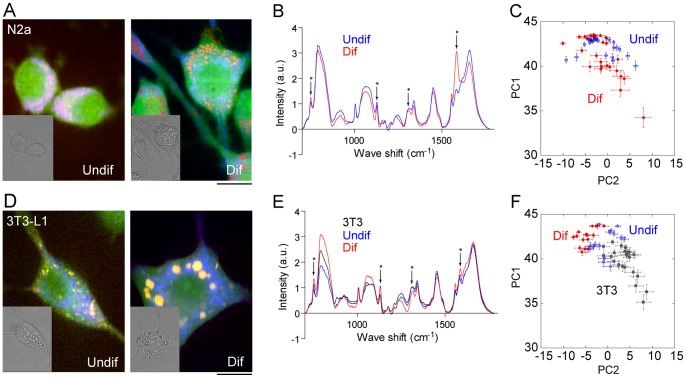
Figure 3. Raman images of cell-lines with differentiation capability.
Raman images of Neuro2a (A) and 3T3L1 (D) cells before (left panel) and after (right panel) the induction of differentiation (inset; bright-field image). (B, E) Averaged Raman spectra of N2a (B) and 3T3L1 (E) cells before (blue) and after (red) induction of differentiation. Spectra are average of 15–27 cells. Spectra from the fibroblast cell-line NIH3T3 are also plotted (black). Peaks characteristic to cytochrome C are indicated with asterisks. (C, F) Score plots of Neuro2a (C) and 3T3L1 (F) cells before (blue) and after (red) the induction of differentiation calculated by PCA. For PCA analysis, raw spectra without averaging was used. Data from the fibroblast cell-line NIH3T3 are also plotted (black). Each marker shows averaged score values of the spectra obtained from single nuclei. Error bar shows SD of the score values from the same nuclei.

