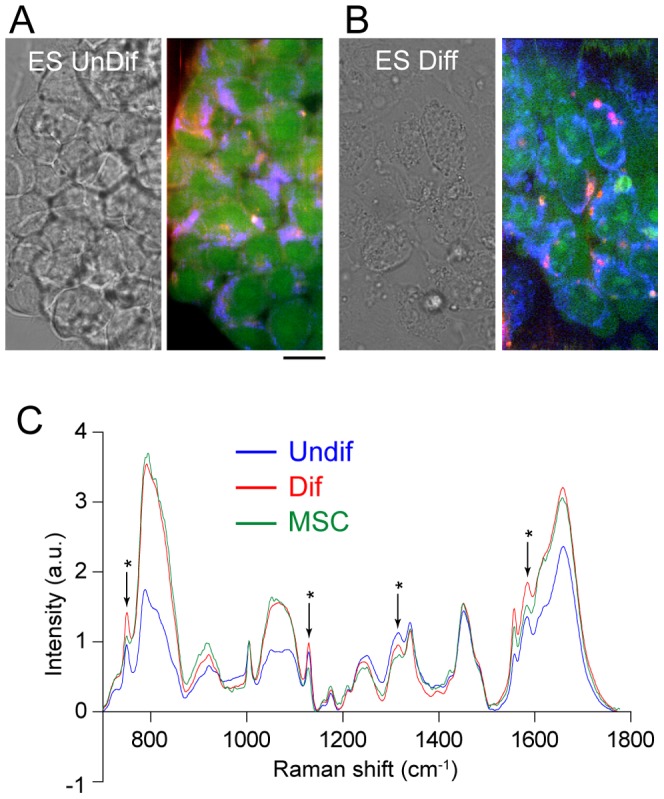
Figure 4. Raman images of ESCs before and after induction of differentiation.

Bright-field (left panel) and Raman images (right panel) of undifferentiated (A) and differentiated (B) ESCs. (C) Averaged Raman spectra of undifferentiated ESCs (blue), differentiated ESCs (red), and MSCs (green) in the fingerprint region (700–1800 cm−1). For PCA analysis, raw spectra without averaging was used. Spectra shown are average of 18–44 cells.
