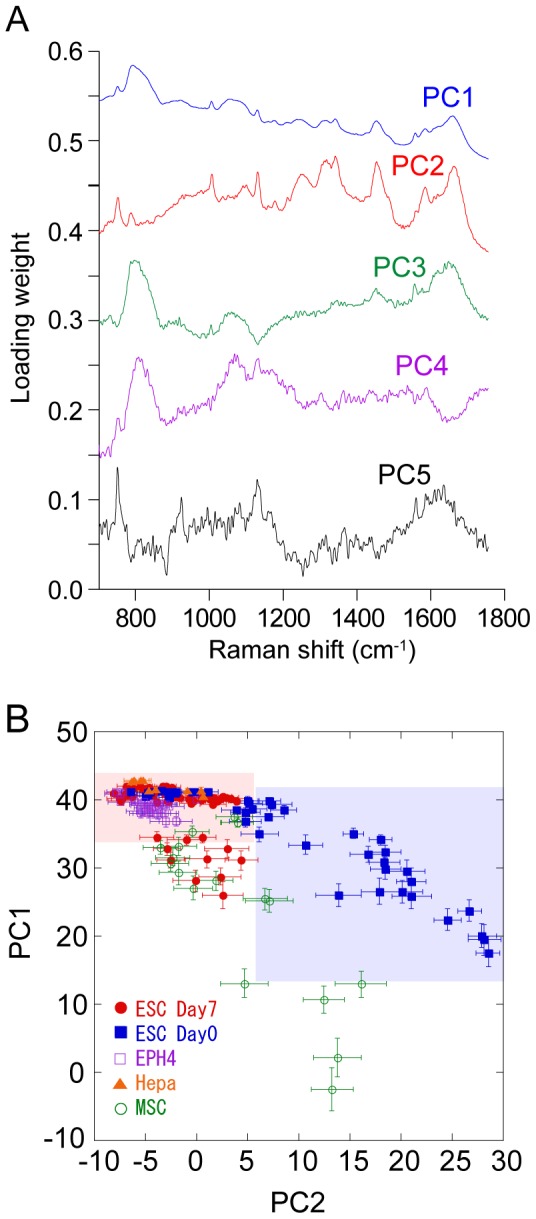
Figure 5. PCA analysis of Raman spectra obtained from ESCs.

(A) Calculated loading vectors of PC1–PC5 of the Raman spectra of the nuclei in the fingerprint region. For PCA analysis, raw spectra without averaging was used. (B) Plot of PC1 and PC2 scores. Each marker shows the average value of the PC1 and PC2 scores of the Raman spectra obtained from single nuclei. Error bars show SD of the score values from the same nuclei.
