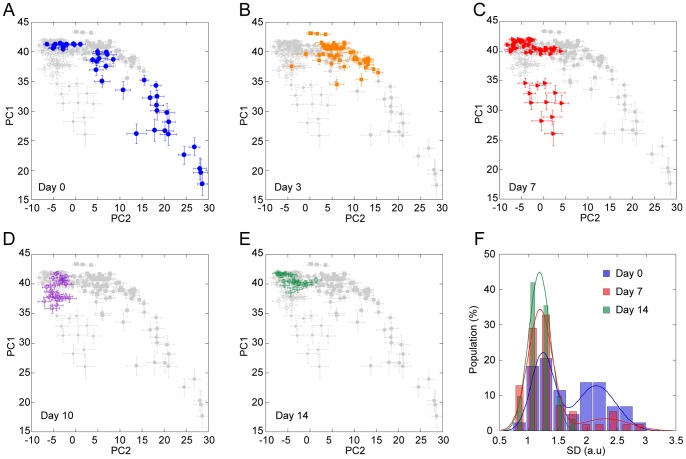
Figure 6. Transition of ESC state during differentiation.
(A–E) Score plots of Raman spectra at various stages of differentiation spanning a period of 2 weeks. Each marker shows averaged score values of the spectra obtained from single nuclei. Error bar shows SD of the score values from the same nuclei. (F) Histograms of the population distribution of the SD relative to PC1 and PC2 before (blue), 1 week (red) and 2 weeks (green) after LIF removal. Solid lines show the results of the fitting achieved with two Gaussian functions.

