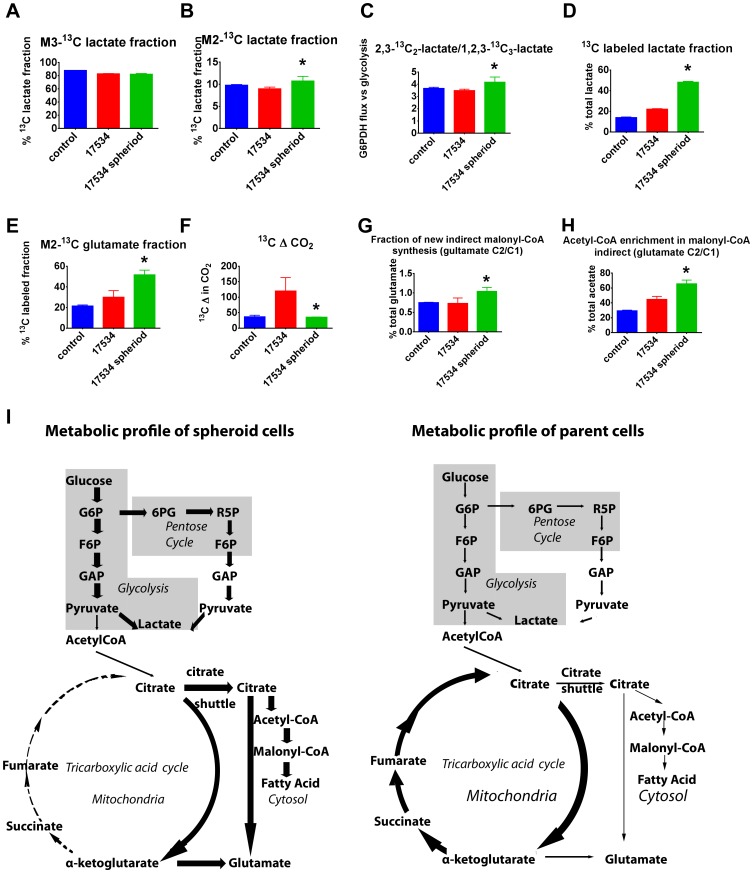
Figure 7. Spheroid cells show a hypoxia-resistant metabolism profile.
Metabolic profiles of a normal ovarian cell line RPNLOv78 as control, EOC cells RP-OV17534, and spheroid RP-OV17534 cells cultures in the presence of [U-13C6]glucose for 24 hrs (n = 3) showing (A) percentages of m3-13C lactate derived directed from glycolysis; (B) percentages of m2-13C lactate derived from pentose cycle; (C) ratio of m2 to m3 lactate; (D) percentage of 13C-labeled lactate of total lactate; (E) percentages of 13C-double-labeled glutamate in total 13C-labeled glutamate; (F) 13CO2 release from [U-13C6]glucose; (G) The fraction of newly synthesized palmitate and the 13C enrichment of acetyl units (H). Error bars: SD; *,p<0.01, compared with parental EOC cells. (I) EOC spheroid cells show increased anaerobic glycolysis, increased direct glucose oxidation in the pentose cycle, but low TCA cycle carbon flux, low anaplerotic flux, and de novo fatty acid synthesis. In contrast, parent EOC cells show increased TCA cycle and high anaplerotic flux. G6P, glucose-6-P; F6P, fructose-6-P; GAP, glyceraldehyde-3-P; 6PG, 6-P-gluconate; R5P, ribulose-5-P. Various thickness of lines represent different strengths of metabolic flux.

