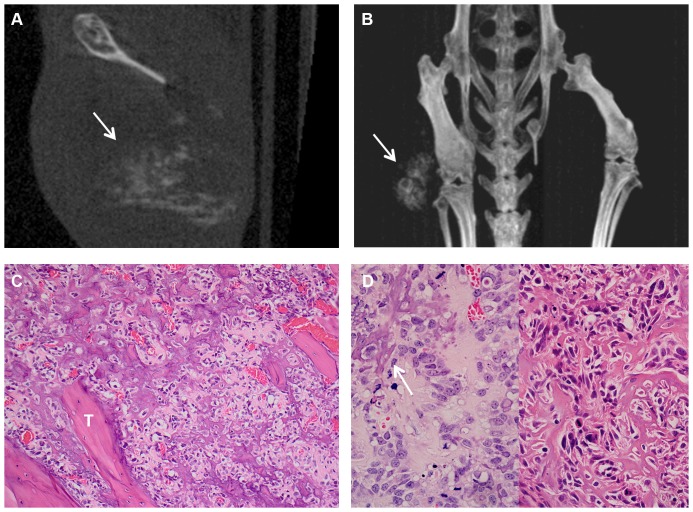
Figure 2. “Malignant” bone formation within the tumour mass after SaOS-2 transplantation.
A, Representative CT image 70 days after intrafemoral transplantation of SaOS-2 cells showing “malignant” bone formation within the extraosseous tumour mass (arrow). B, Representative Maximum Intensity Projection CT image of a mouse bearing a SaOS tumour 70 days after transplantation, showing “malignant” bone formation within the extraosseous tumour mass (arrow). C, “Malignant” bone forming amongst tumour cells in the medullary cavity, showing appositional deposition (scaffolding) on existing bone trabeculae (“T”) (H&E, original magnification 200×). D, Left panel: malignant tumour cells amongst pale eosinophilic osteoid which is partially mineralised (arrow) (H&E, original magnification 400×). Right panel: fine, randomly arborising strands of mineralised osteoid (“malignant” bone) amongst SaOS-2 tumour cells (H&E, original magnification 400×).

