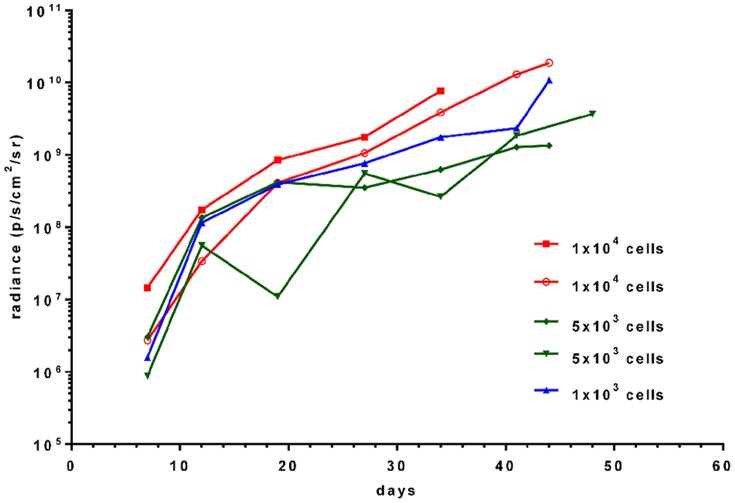
Figure 10. Timecourse of bioluminescent signal in mice injected with low numbers of transduced TC-71 cells.
Depicted is the development of signal intensity for 5 animals injected with either 1×10³, 5×10³ or 1×10⁴ cells in a volume of 10 µl. The experiment was performed with EGFP sorted cells one week prior to injection.

