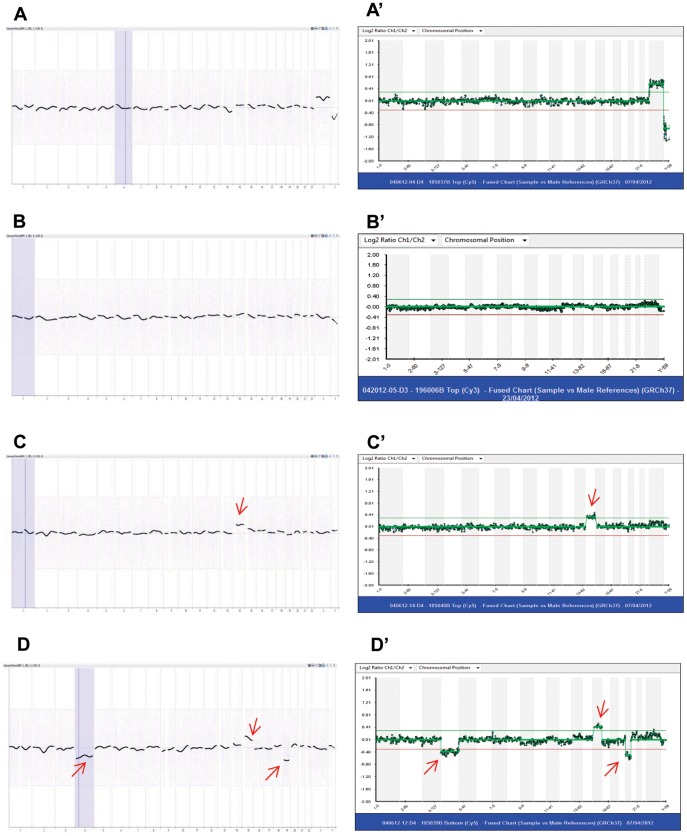
Figure 1. PGS charts of human blastocyst biopsies from Agilent oligo and Illumina BAC DNA array platforms.
Charts in left column are from Agilent and charts in right column are from Illumina BAC platforms. A and A': 46 XX; B and B': 46 XY; C and C': 47 XY, +14; D and D': 45 XY, −4, +15, -19. Arrows indicate chromosomal errors. Data matched between two array platforms.

