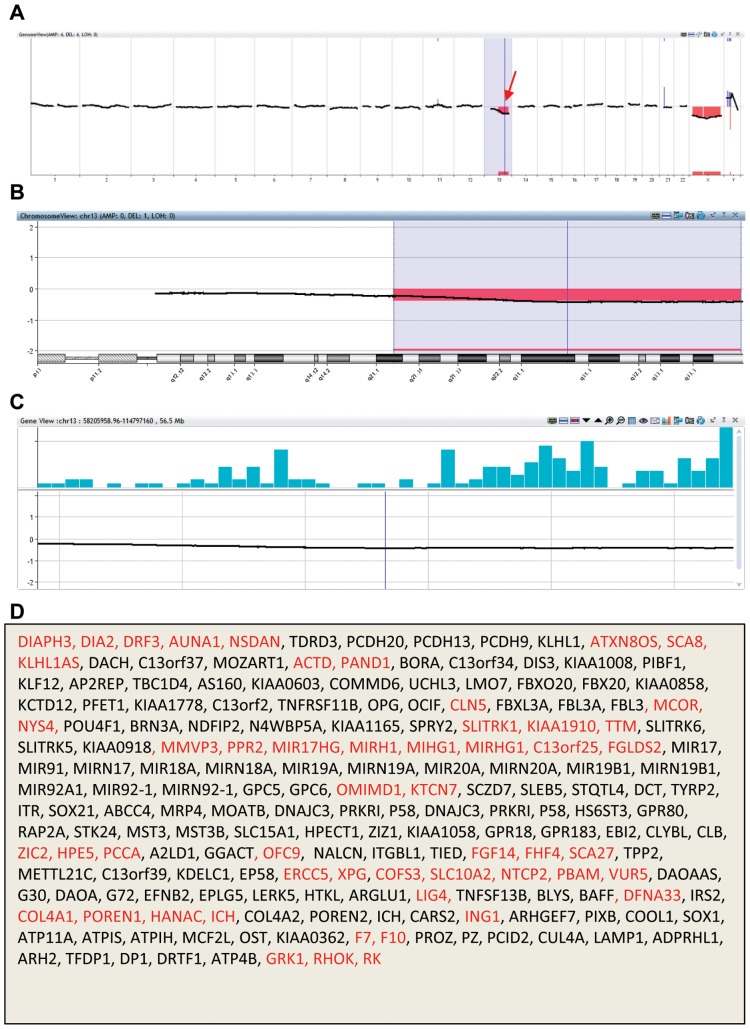
Figure 4. PGS chart, chromosomal view, gene view and gene list of a human blastocyst biopsy analyzed with Agilent array platform.
The PGS chart (A) shows one chromosomal deletion (arrow) in chromosome 13. Chromosomal view chart (B) shows the deletion location (13q21–13q33). Gene view chart (C) shows the location of genes (58,205,958–114,797,160) and D shows the list of lost genes in the deleted region. Genes marked with red are those related with phenotypes.

