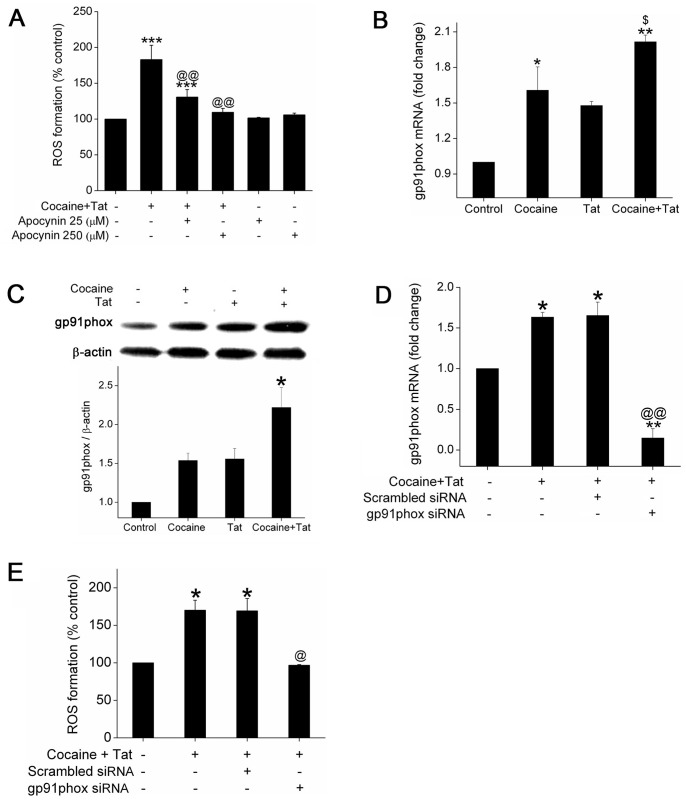
Figure 3. Inhibition or knockdown of NADPH oxidase attenuates Tat and cocaine-mediated ROS formation.
(A) HPMECs were treated with various concentrations of apocynin for 30 min followed by exposure to Tat/cocaine for 1 hour. Total ROS formation was measured by DCFDA assay. (B) HPMECs were treated with cocaine and/or Tat for 24 h followed by quantitative mRNA analysis of gp91phox (NOX2) by Real-Time RT-PCR using the SYBR Green detection method. C) Western blot analysis of gp91phox in HPMECs treated with cocaine and/or Tat for 48 h.The upper panel is the representative blot of gp91phox expression and lower panel is the histogram showing the densitometry analyses of 3 independent experiments (mean±SEM). (D) NOX2 mRNA expression and E) ROS generation in HPMECs transfected with scrambled or gp-91phox siRNA (5 nM). Cells were loaded with DCFDA for 30 min before 1 hour Tat/cocaine treatment for quantification of total ROS generation. The values shown are means (±SD) of two-three independent experiments. *P≤0.05, **P≤0.01, ***P≤0.001, compared to control; $P<0.05 compared with Tat treatment alone, @P≤0.05, @@P≤0.001, compared to cocaine and Tat treatment.

