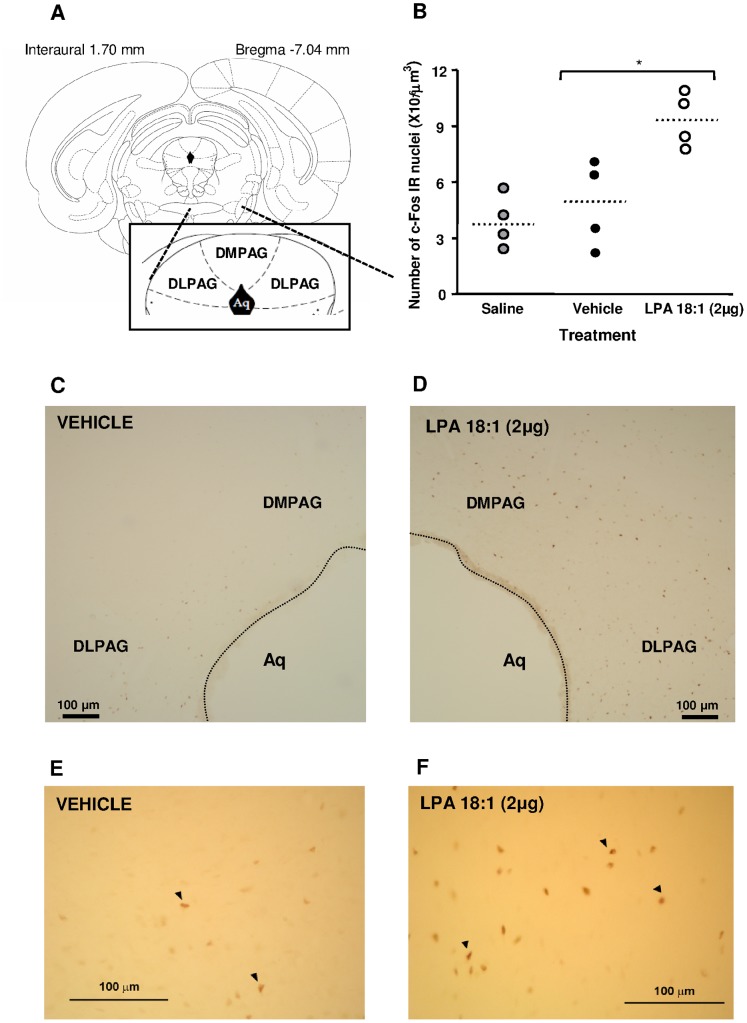
Figure 5. c-Fos immunohistochemistry in the rat dorsal periaqueductal gray matter (PAG) following LPA 18∶1 infusion at doses of 0 and 2 µg.
Analyses were performed in the dorsomedial and dorsolateral divisions of the PAG (A). Stereological quantification of c-Fos immunoreactive (IR) nuclei in the DPAG (B). Low magnification microphotographs for c-Fos immunohistochemistry are depicted for the vehicle (C)- and LPA 18∶1 (D)-treated groups. In addition, high magnification images for the vehicle (E)- and LPA 18∶1 (F)-treated groups are shown. Each point represents the total number of immunopositive nuclei per animal. The dotted lines are medians (n = 4 animals pr group). The data were analyzed using Kruskal-Wallis one-way ANOVA. *p<0.05 denotes significant differences versus the vehicle-treated group, determined using Dunn’s post-hoc test. The arrowheads indicate immunopositive nuclei for c-Fos.

